103
The Configured Zonesets Data window uses display conventions for expanding and contracting entries that are
similar to the fabric tree. An entry handle to the left of an entry in the tree indicates that you can expand the
entry. Click this handle or double-click the following entries to expand or contract them:
• A zone set entry expands to show its member zones.
• A zone entry expands to show its members by port number, worldwide name, or Fibre Channel address.
Alarm Log Data window
The Alarm Log Data window displays switch module event information. To open the Alarm Log Data
window, click the Alarm Log tab below the data window in the Faceplate window.
Managing alarms
You can configure the switch module to generate and log alarms. To display the Alarm Log, click the Alarm
Log tab in the Faceplate window. For information about the alarm log, see “Alarm Log Data window.” You can
also export the alarm log to a file in XML format.
Configuring alarms
Configuring an alarm involves choosing an event type, rising and falling thresholds, a sampling interval, and
then enabling or disabling the alarm.
Complete the following steps to configure an alarm:
1. In the Faceplate window, click
Switch ” Configure Alarm Thresholds.
2. The
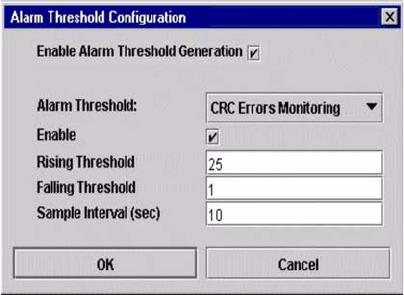
Alarm Threshold Configuration window shown in Figure 14 on page 103 prompts you to
select an event, set thresholds, set a sampling interval, and enable or disable the alarm.
Figure 14. Alarm Threshold Configuration window
3. Select an event type from the
Alarm Threshold pull-down menu. Choose from the following
options:
• CRC error monitoring
• Decode error monitoring
• ISL monitoring
• Login monitoring
• Logout monitoring
• Loss of signal monitoring
4. Enter a value in the
Falling Threshold field. The falling threshold is the event count above which an
event becomes eligible for logging in the alarm log.
