


112 Intel Blade Server Switch Module SBCEFCSW Management and User’s Guide
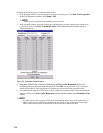
Displaying SFP module media status
To display SFP module media status, click View / View Port Media. Table 27 lists and describes the available
media states.
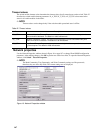
Port graphing and Fabric View application
You can use the Fabric View application to view port performance as graphs. The Fabric View window
displays data communication rates and total errors for selected ports as shown in Figure 23 on page 129. You
can graph communication data rates using either frames per second or KB per second. For more information
about port graphing, see “Using the Fabric View application” on page 128.
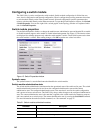
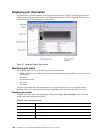
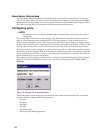
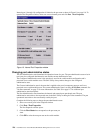
Port Statistics Data window
The Port Statistics Data window displays statistics about port performance. To open the Port Statistics Data
window, select one or more ports in the Faceplate window and click the Port Stats tab in the data pane of the
Faceplate window. Table 28 describes the Port Statistics Data window entries. See Table 37 on page 131 for
information about port numbering and mapping.
The Statistics menu is available on the Port Statistics Data window. Click the down arrow to open the Statistics
menu and then use one of the following methods to view the detailed port information:
• Click Absolute to view the total count of statistics since the last switch module reset.
• Click Rate to view the number of statistics counted per second over the polling period.
• Click Baseline to view the total count of statistics since the last time the baseline was set.
When viewing baseline statistics, click Clear Baseline to set the current baseline.
Table 27. SFP module media view
Media icon Description
The SFP module is online (green)
The SFP module is offline (gray)
None The port is empty; no SFP module is detected or installed
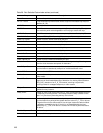
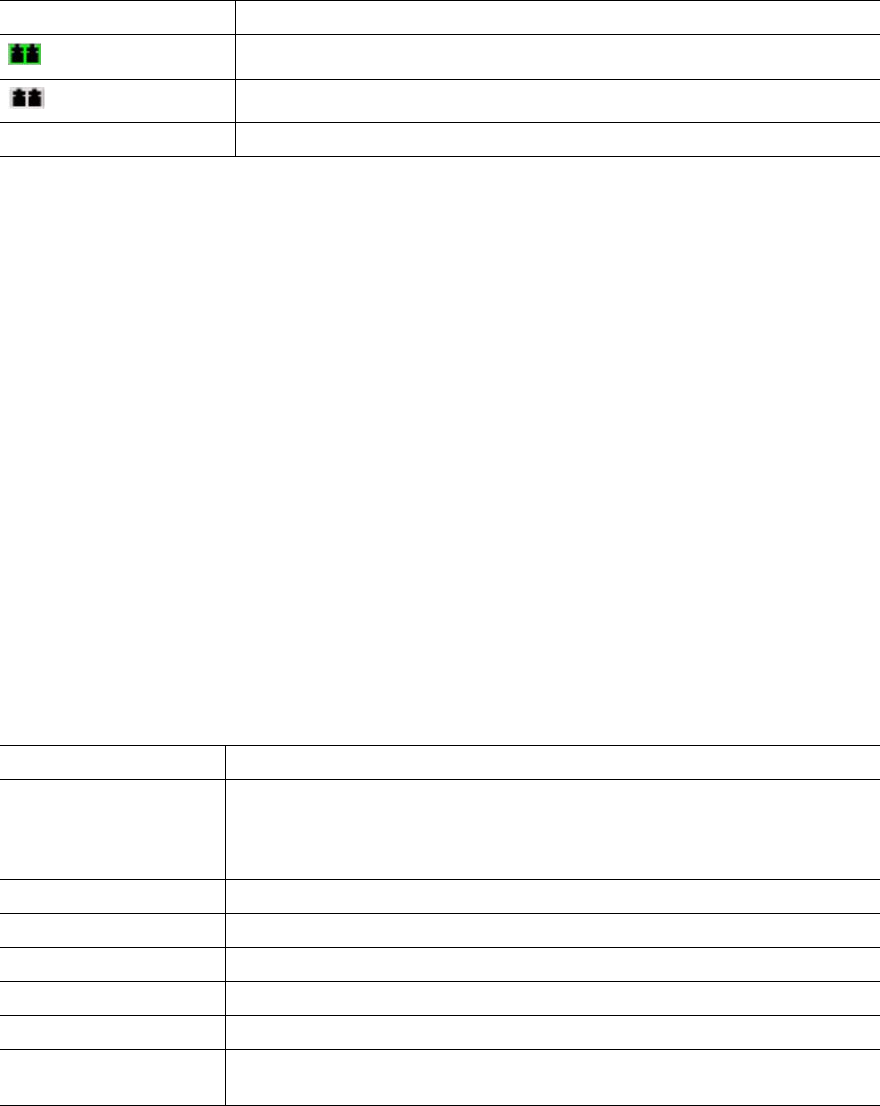
Table 28. Port Statistics Data window entries
Entry Description
Start time The beginning of the period of time for which the statistics apply. The start time
for the Absolute view is not applicable. The start time for the Rate view is the
beginning of the polling interval. The start time for the Baseline view is the last
time the baseline was set.
End time The last time the statistics were updated on the display.
Total time Total time period from start time to end time.
Login count Number of logins that have occurred on the switch module.
Logout count Number of logouts that have occurred on the switch module.
AI init count Number of times the port entered the initialization state.
Invalid destination
address
Number of address identifiers (S_ID, D_ID) found to be in error.