


xStack
®
DES-3200-10/18/28/28F Layer 2 Ethernet Managed Switch User Manual
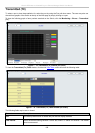
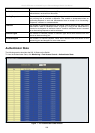
Transmitted (TX)
To select a port to view these statistics for, select the port by using the Port pull-down menu. The user may also use
the real-time graphic of the Switch at the top of the Web page by simply clicking on a port.
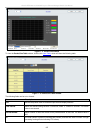
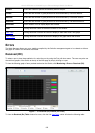
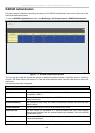
To view the following graph of error packets received on the Switch, click the Monitoring > Errors > Transmitted
(Tx) :
Figure 7 - 15. Transmitted (Tx) window (for errors)
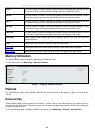
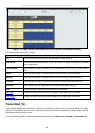
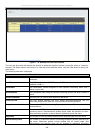
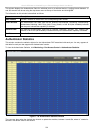
To view the Transmitted (Tx) Table window, click the link View Table
, which will show the following table:
Figure 7 - 16. Transmitted (Tx) Table window (for errors)
The following fields may be set or viewed:
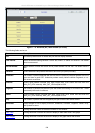
Parameter Description
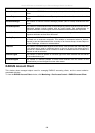
Port
Use the drop-down menu to choose the port that will display statistics.
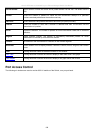
Time Interval
Select the desired setting between 1s and 60s, where "s" stands for seconds. The default
value is one second.
195