


Statistics aplet 8-9
To continue our example, suppose that the heights of the rest
of the students in the class are measured, but each one is
rounded to the nearest of the five values first recorded. Instead
of entering all the new data in C1, we shall simply add another
column, C2, that holds the frequencies of our five data points
in C1.
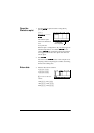
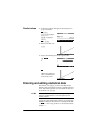
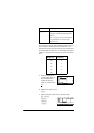
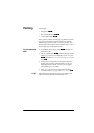
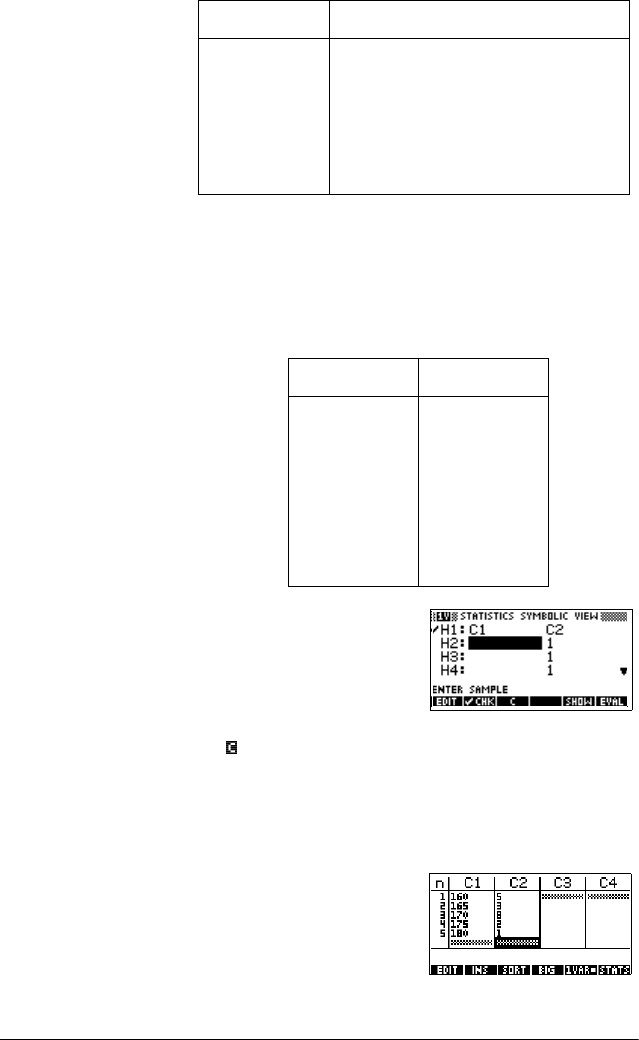
5. Move the highlight bar
into the right column of
the H1 definition and
replace the frequency
value of 1 with the name
C2.
2
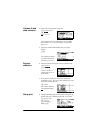
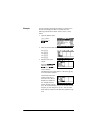
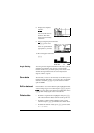
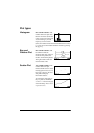
6. Return to the numeric view.
>180@
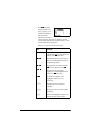
7. Enter the frequency data shown in the above table.
*A,5>(17(5@
3>(17(5@
8>(17(5@
2>(17(5@
1>(17(5@
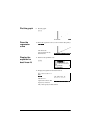
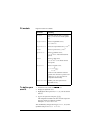
>6+,)7@
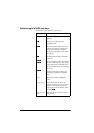
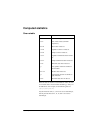
CLEAR Resets default specifications for the
data sets or clears the edit line (if it was
active).
Note: If >6+,)7@
CLEAR is used the data
sets will need to be selected again
before re-use.
Key Meaning (Continued)
Height (cm) Frequency
160 5
165 3
170 8
175 2
180 1