


Statistics aplet 8-17
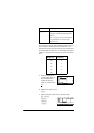
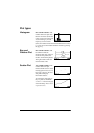
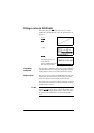
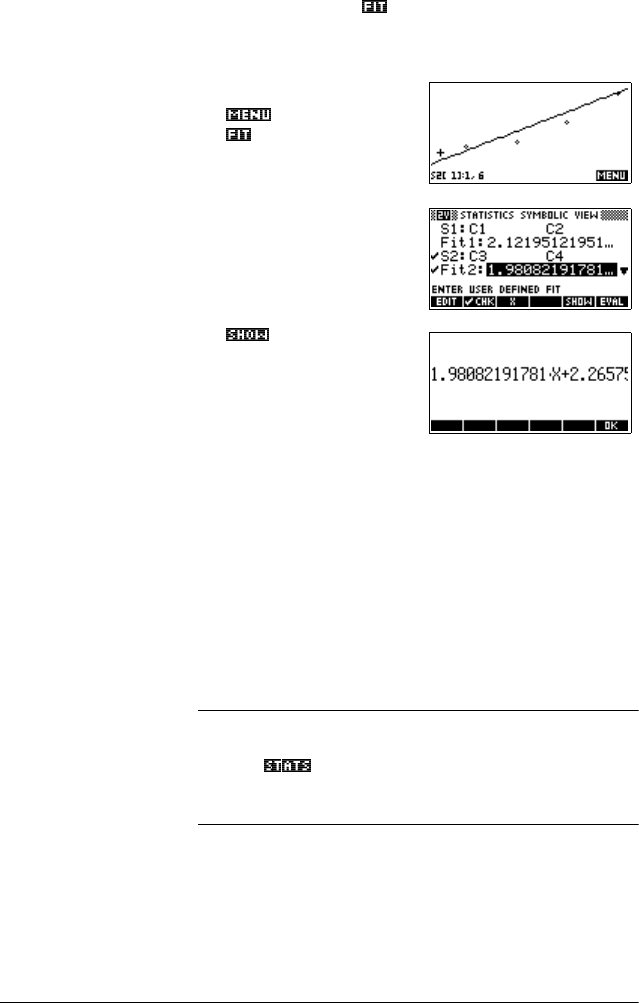
Fitting a curve to 2VAR data
In the Plot view, press . This draws a curve to fit the
checked two-variable data set(s). See “To choose the fit” on
page 8-11.
>3/27@
>6<0%@
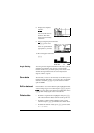
The expression in Fit2
shows that the
slope=1.98082191781 and
the y-intercept=2.2657.
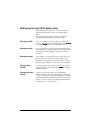
Correlation
coefficient
The correlation coefficient is stored in the CORR variable. It is
a measure of fit to a linear curve only. Regardless of the Fit
model you have chosen, CORR relates to the linear model.
Relative Error The relative error is stored in a variable named RELERR. The
relative error provides a measure of fit accuracy for all fits,
and it does depend on the Fit model you have chosen.
The relative error is a measure of the error between predicted
values and actual values based on the specified Fit. A smaller
number means a better fit.
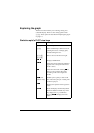
HINT
In order to access these variables after you plot a set of
statistics, you must press >180@ to access the numeric view
and then
to display the correlation values. The values
are stored in the variables when you access the Symbolic
view.