


2-8 Aplets and their views
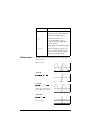
Trace a graph You can trace along a function using the *>, or* A, key which
moves the cursor along the graph. The display also shows the
current coordinate position (x, y) of the cursor. Trace mode
and the coordinate display are automatically set when a plot is
drawn.
Note: Tracing might not appear to exactly follow your plot if
the resolution (in Plot Setup view) is set to Faster. This is
because RES: FASTER plots in only every other column,
whereas tracing always uses every column.
In Function and Sequence Aplets: You can also scroll
(move the cursor) left or right beyond the edge of the display
window in trace mode, giving you a view of more of the plot.
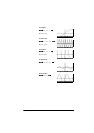
To move between
relations
If there is more than one relation displayed, press *k, or *e,
to move between relations.
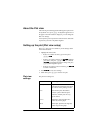
To jump directly
to a value
To jump straight to a value rather than using the Trace
function, use the
menu key. Press , then enter a
value. Press
to jump to the value.
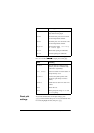
To turn trace on/
off
If the menu labels are not displayed, press first.
• Turn off trace mode by pressing .
• Turn on trace mode by pressing .
• To turn the coordinate display off, press .
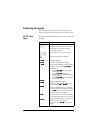
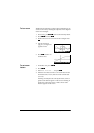
Zoom within a
graph
One of the menu key options is . Zooming redraws the
plot on a larger or smaller scale. It is a shortcut for changing
the Plot Setup.
With the Set Factors option you can specify the factors that
determine the extent of zooming, and whether the zoom is
centered about the cursor.
ZOOM options Press , select an option, and press . (If is not
displayed, press
.) Not all options are available in
all aplets.
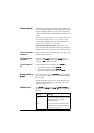
Option Meaning
Center Re-centers the plot around the current
position of the cursor without
changing the scale.
Box... Lets you draw a box to zoom in on. See
“Other views for scaling and splitting
the graph” on page 2-13.