


Statistics aplet 8-15
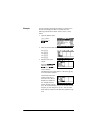
Plotting You can plot:
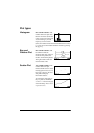
•histograms ( )
• box-and-whisker plots (
)
• scatter plots of data (
).
Once you have entered your data (>180@), defined your data
set (>6<0%@), and defined your Fit model for two-variable
statistics (>6+,)7@
SETUP-SYMB), you can plot your data. You
can select up to five scatter or box-and-whisker plots at a time.
You can plot only one histogram at a time.
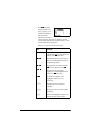
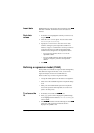
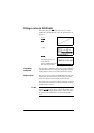
To plot statistical
data
1. In Symbolic view (>6<0%@), select ( ) the data sets
you want to plot.
2. For one-variable data ( ), select the plot type in Plot
Setup (>6+,)7@
SETUP-PLOT). Highlight STATPLOT, press
, select either Histogram or BoxWhisker, and
press
.
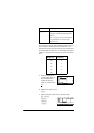
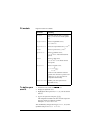
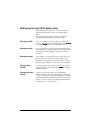
3. For any plot, but especially for a histogram, adjust the
plotting scale and range in the Plot Setup view. If you
find histogram bars too fat or too thin, you can adjust
them with the HWIDTH setting.
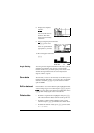
4. Press >3/27@. If you have not adjusted the Plot Setup
yourself, you can try >9,(:6@ select Auto Scale
.
HINT
Auto Scale can be relied upon to give a good starting scale
which can then be adjusted in the Plot Setup view.