


Statistics aplet 8-19
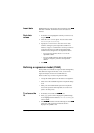
Trouble-shooting a plot
If you have problems plotting, check that you have the
following:
• The correct or menu label on (Numeric
view).
• The correct fit (regression model), if the data set is two-
variable.
• Only the data sets to compute or plot are checkmarked
(Symbolic view).
• The correct plotting range. Try using >9,(:6@ Auto
Scale (instead of >3/27@), or adjust the plotting
parameters (in Plot Setup) for the ranges of the axes and
the width of histogram bars (HWIDTH).
•In mode, ensure that both paired columns contain
data, and that they are the same length.
•In mode, ensure that a paired column of frequency
values is the same length as the data column that it refers
to.