


Statistics aplet 8-7
Example You are measuring the height of students in a classroom to
find the mean height. The first five students have the
following measurements 160cm, 165cm, 170cm, 175cm,
180cm.
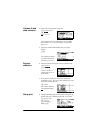
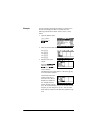
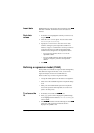
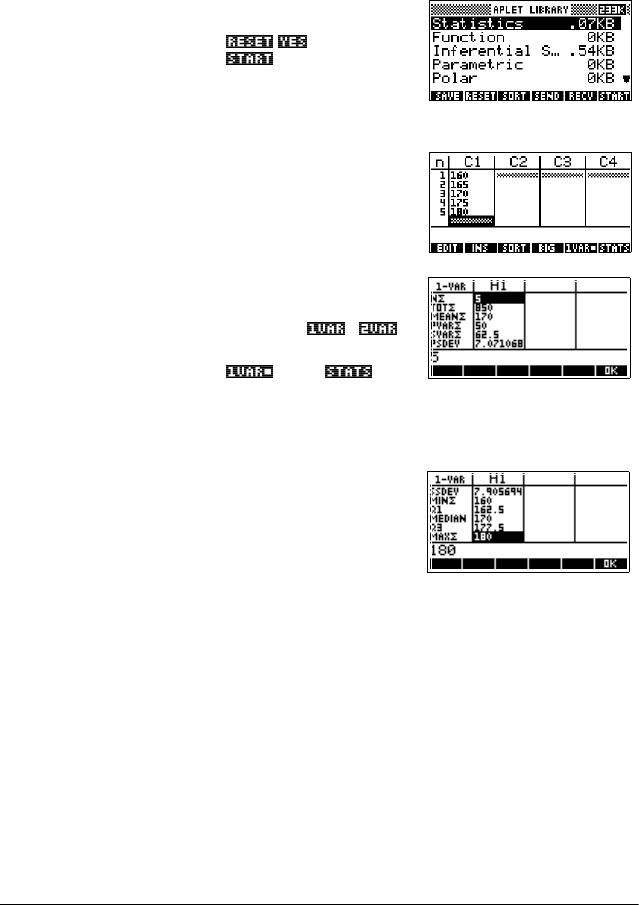
1. Open the Statistics aplet.
>$3/(7@ Select
Statistics
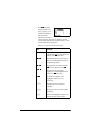
2. Enter the measurement data.
160 >(17(5@
165 >(17(5@
170 >(17(5@
175 >(17(5@
180 >(17(5@
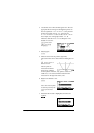
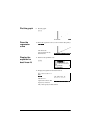
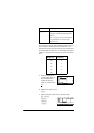
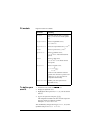
3. Find the mean of the
sample.
Ensure the
/
menu key label reads
. Press to
see the statistics
calculated from the sample data in C1. Press the *e, key
to scroll to further statistics.
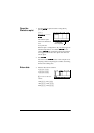
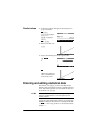
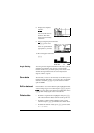
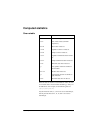
Note that the title for the
column of statistics is
H1. There are 5 data set
definitions available for
one-variable statistics:
H1–H5. If data is entered
in C1, H1 is automatically set to use C1 for data, and the
frequency of each data point is set to 1. You can select
other columns of data from the Statistics Symbolic setup
view.