


Aplets and their views 2-13
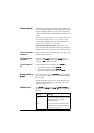
Other views for scaling and splitting the graph
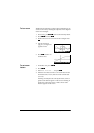
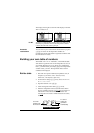
The preset viewing options menu (>9,(:6@) contains options
for drawing the plot using certain pre-defined configurations.
This is a shortcut for changing Plot view settings. For
instance, if you have defined a trigonometric function, then
you could select Trig to plot your function on a
trigonometric scale. It also contains split-screen options.
In certain aplets, for example those that you download from
the world wide web, the preset viewing options menu can also
contain options that relate to the aplet.
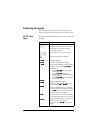
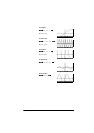
VIEWS menu
options
Press >9,(:6@, select an option, and press .
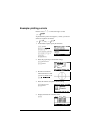
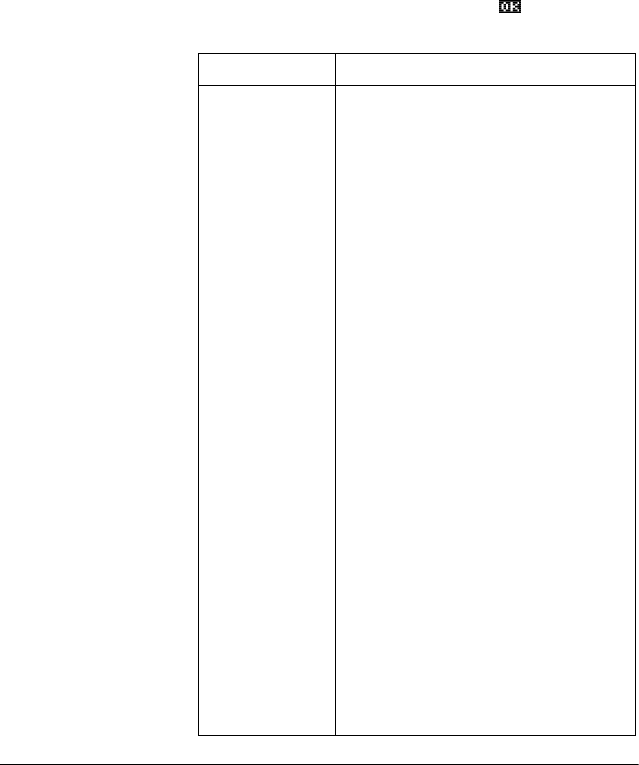
Option Meaning
Plot-
Detail
Splits the screen into the plot and a
close-up.
Plot-Table Splits the screen into the plot and the
data table.
Overlay
Plot
Plots the current expression(s) without
erasing any pre-existing plot(s).
Auto Scale Rescales the vertical axis so that the
display shows a representative piece of
the plot, for the supplied x axis
settings. (For Sequence and Statistics
aplets, autoscaling rescales both axes.)
The autoscale process uses the first
selected function only to determine the
best scale to use.
Decimal Rescales both axes so each pixel = 0.1
unit. Resets default values for XRNG
(–6.5 to 6.5) and YRNG (–3.1 to 3.2).
(Not in Sequence or Statistics aplets.)
Integer Rescales horizontal axis only, making
each pixel=1 unit. (Not available in
Sequence or Statistics aplets.)
Trig Rescales horizontal axis so
1 pixel=π/24 radian, 7.58, or
8
1
/
3
grads; rescales vertical axis so
1 pixel = 0.1 unit.
(Not in Sequence or Statistics aplets.)