


9-8 Inference aplet
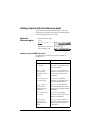
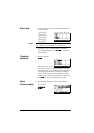
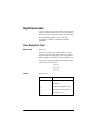
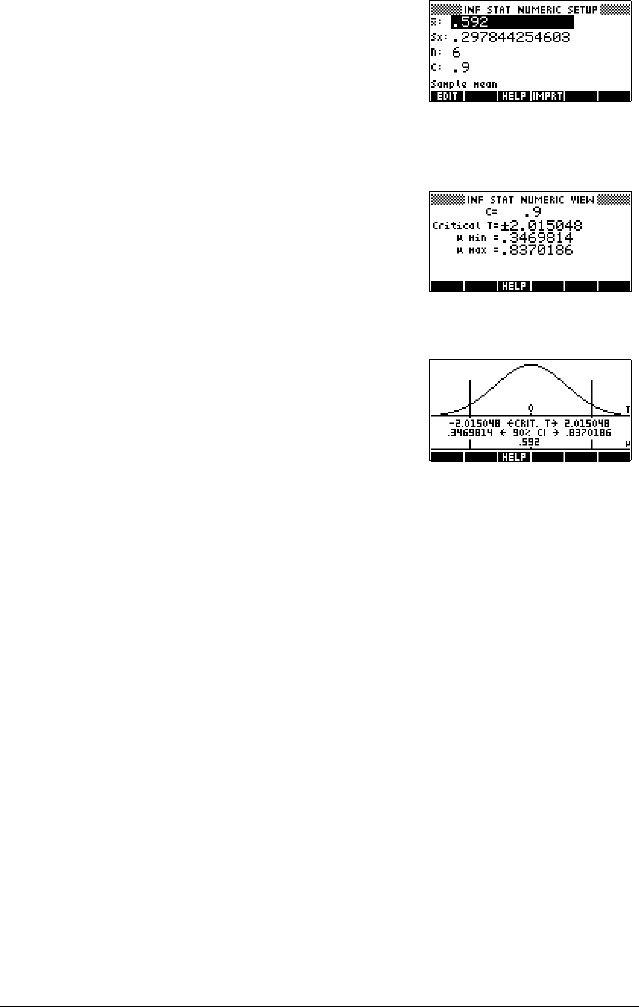
11. Specify a 90% confidence interval in the C: field.
*e,*e,*e, to move to the
C: field
0.9 >(17(5@
Display
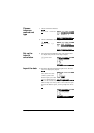
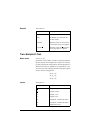
Numeric view
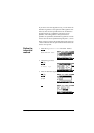
12. Display the confidence interval in the Numeric view.
Note: The interval setting is 0.5.
>180@
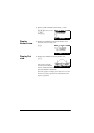
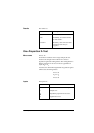
Display Plot
view
13. Display the confidence interval in the Plot view.
>3/27@
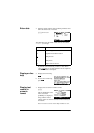
You can see, from the
second text row, that the
mean is contained within the 90% confidence interval
(CI) of 0.3469814 to 0.8370186.
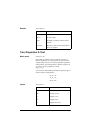
Note: The graph is a simple, generic bell-curve. It is not
meant to accurately represent the t-distribution with 5
degrees of freedom.