


Statistics aplet 8-11
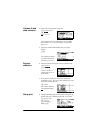
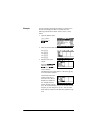
Insert data Highlight the entry following the point of insertion. Press ,
then enter a number. It will write over the zero that was
inserted.
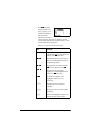
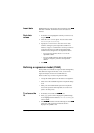
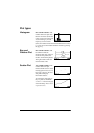
Sort data
values
1. In Numeric view, highlight the column you want to sort,
and press
.
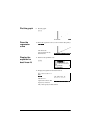
2. Select the SORT ORDER option. You can choose either
Ascending or Descending.
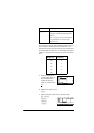
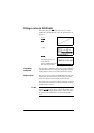
3. Specify the INDEPENDENT and DEPENDENT data
columns. Sorting is by the independent column. For
instance, if Age is C1 and Income is C2 and you want to
sort by Income, then you make C2 the independent
column for the sorting and C1 the dependent column.
– To sort just one column, choose None for the
dependent column.
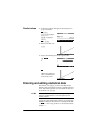
– For one-variable statistics with two data columns,
specify the frequency column as the dependent
column.
4. Press
.
Defining a regression model (2VAR)
The Symbolic view includes an expression (Fit1 through Fit5)
that defines the regression model, or “fit”, to use for the
regression analysis of each two-variable data set.
There are three ways to select a regression model:
• Accept the default option to fit the data to a straight line.
• Select one of the available fit options in Symbolic Setup
view.
• Enter your own mathematical expression in Symbolic
view. This expression will be plotted, but it will not be
fitted to the data points.
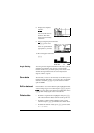
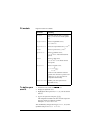
To choose the
fit
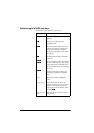
1. In Numeric view, make sure is set.
2. Press >6+, )7@
SETUP-SYMB to display the Symbolic Setup
view. Highlight the Fit number (S1FIT to S5FIT) you
want to define.
3. Press
and select from the following list. Press
when done. The regression formula for the fit is
displayed in Symbolic view.