


8-20 Statistics aplet
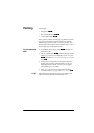
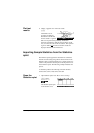
Exploring the graph
The Plot view has menu keys for zooming, tracing, and
coordinate display. There are also scaling options under
>9,(:6@. These options are described in“Exploring the graph”
on page 2-7.
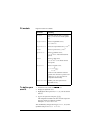
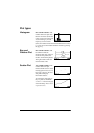
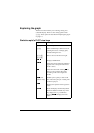
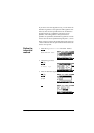
Statistics aplet’s PLOT view keys
Key Meaning
>6+,)7@CLEAR Erases the plot.
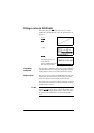
>9,(:6@ Offers additional pre-defined views for
splitting the screen, overlaying plots,
and autoscaling the axes.
>6+,)7@*>,
>6+,)7@*A,
Moves cursor to far left or far right.
Displays ZOOM menu.
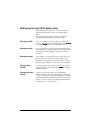
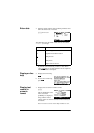
Turns trace mode on/off. The white box
appears next to the option when Trace
mode is active.
Turns fit mode on/off. Turning on
draws a curve to fit the data points
according to the current regression
model.
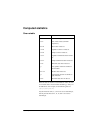
(2var
statistics only)
Enables you to specify a value on the
line of best fit to jump to or a data point
number to jump to.
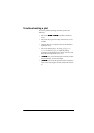
Displays the equation of the regression
curve.
Hides and displays the menu key labels.
When the labels are hidden, any menu
key displays the (x,y) coordinates.
Pressing
redisplays the menu
labels.