


3-2 Function aplet
Define the
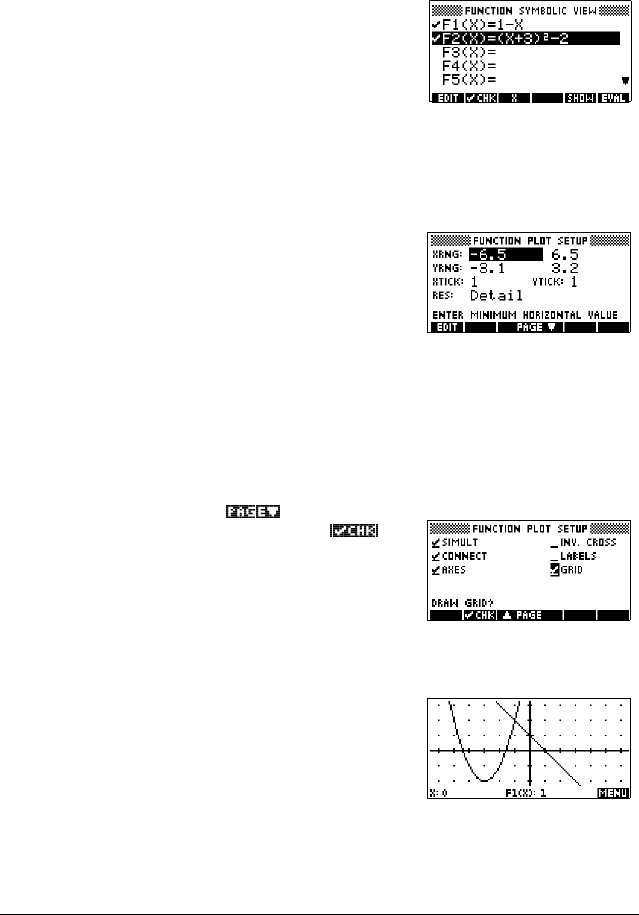
expressions
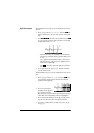
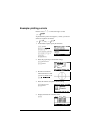
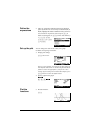
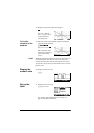
2. There are 10 function definition fields on the Function
aplet’s Symbolic view screen. They are labeled F1(X) to
F0(X). Highlight the function definition field you want to
use, and enter an expression. (You can press >' (/@ to
delete an existing line, or >6+,)7@CLEAR to clear all lines.)
1>@>;75@>(17(5@
>@ >;75@>@ 3 >@ >;@
>@ 2 >(17(5@
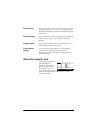
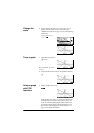
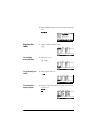
Set up the plot You can change the scales of the x and y axes, graph
resolution, and spacing of axis ticks.
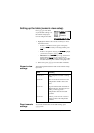
3. Display plot settings.
>6+,)7@
SETUP-PLOT
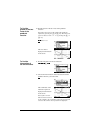
Note: For our example, you can leave the plot settings at
their default values since we will be using the Auto Scale
feature to choose an appropriate y axis for our x axis
settings. If your settings do not match this example, press
>6+,)7@
CLEAR to restore the default values.
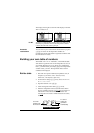
4. Specify a grid for the graph.
*A,*e,*e,
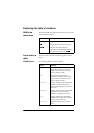
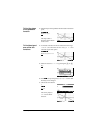
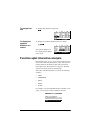
Plot the
functions
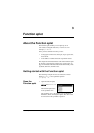
5. Plot the functions.
>3/27@