


Statistics aplet 8-1
8
Statistics aplet
About the Statistics aplet
The Statistics aplet can store up to ten separate data sets at one
time. It can do one-variable or two-variable statistical analysis
of one or more sets of data.
The Statistics aplet starts with the Numeric view which is used
to enter data. The Symbolic view is used to specify which
columns contain data and which column contains frequencies.
You can also compute statistics values in HOME and recall
the values of specific statistics variables.
The values computed in the Statistics aplet are saved in
variables, and many of these variables are listed by the
function accessible from the Statistics aplet’s Numeric view
screen.
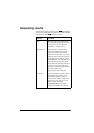
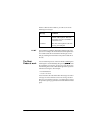
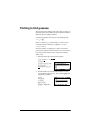
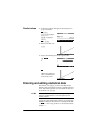
Getting started with the Statistics aplet
The following example asks you to enter and analyze the
advertising and sales data (in the table below), compute
statistics, fit a curve to the data, and predict the effect of more
advertising on sales.
Advertising minutes
(independent, x)
Resulting
Sales ($) (dependent, y)
21400
1 920
31100
52265
52890
42200