


Inference aplet 9-5
Plot test
results
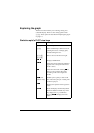
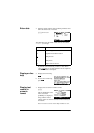
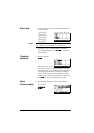
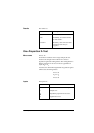
8. Display a graphic view of the test results.
>3/27@
Horizontal axes are
presented for both the
distribution variable and
the test statistic. A generic
bell curve represents the probability distribution
function. Vertical lines mark the critical value(s) of the
test, as well as the value of the test statistic. The rejection
region is marked and the test numeric results are
displayed between the horizontal axes.
Importing Sample Statistics from the Statistics
aplet
The Inference aplet supports the calculation of confidence
intervals and the testing of hypotheses based on data in the
Statistics aplet. Computed statistics for a sample of data in a
column in any Statistics-based aplet can be imported for use
in the Inference aplet. The following example illustrates the
process.
A calculator produces the following 6 random numbers:
0.529, 0.295, 0.952, 0.259, 0.925, and 0.592
Open the
Statistics aplet
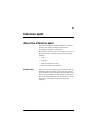
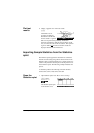
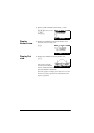
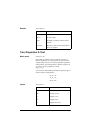
1. Open Statistics aplet. Note: Reset current settings.
>$3/(7@ Select
Statistics
The Statistics aplet opens
in the Numeric view.
R