


8-16 Statistics aplet
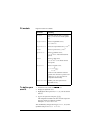
Plot types
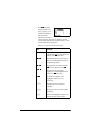
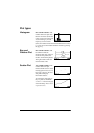
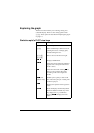
Histogram One-variable statistics. The
numbers below the plot mean
that the current bar (where the
cursor is) starts at 0 and ends at
2 (not including 2), and the
frequency for this column,
(that is, the number of data elements that fall between 0 and 2)
is 1. You can see information about the next bar by pressing
the *A,key.
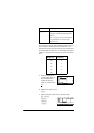
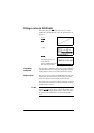
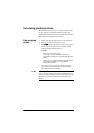
Box and
Whisker Plot
One-variable statistics. The
left whisker marks the
minimum data value. The box
marks the first quartile, the
median, and the third quartile.
The right whisker marks the
maximum data value.
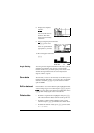
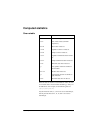
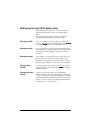
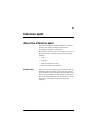
Scatter Plot Two-variable statistics. The
numbers below the plot
indicate that the cursor is at the
first data point for S2, at (1, 6).
Press *A, to move to the next
data point and display
information about it.
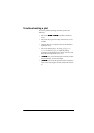
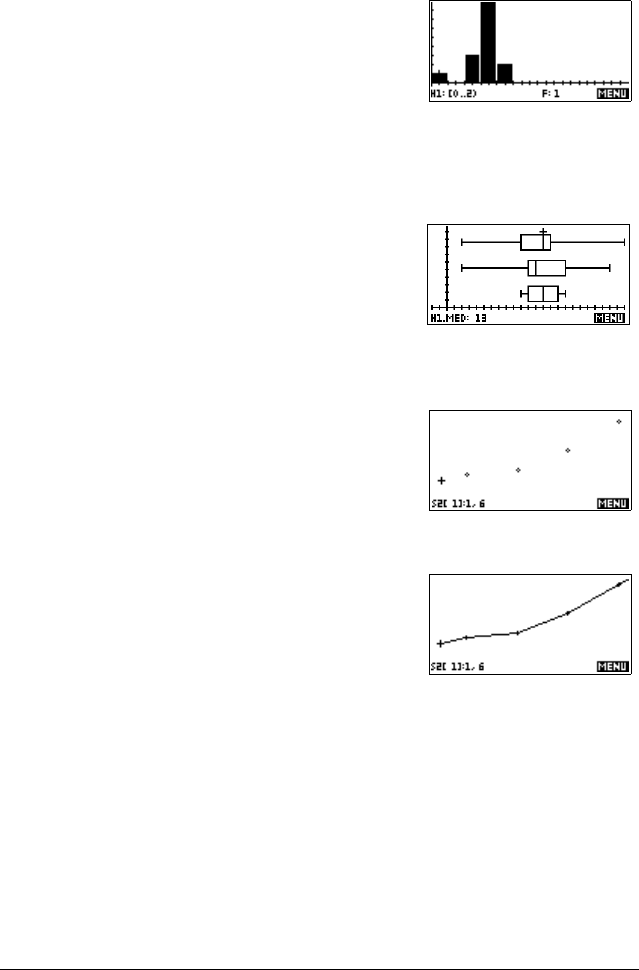
To connect the data points as
they are plotted, checkmark
CONNECT in the second page
of the Plot Setup. This is not a
regression curve.