


Aplets and their views 2-5
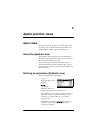
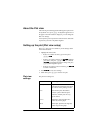
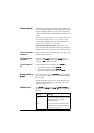
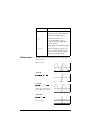
About the Plot view
After entering and selecting (check marking) the expression in
the Symbolic view, press >3/27@. To adjust the appearance of
the graph or the interval that is displayed, you can change the
Plot view settings.
You can plot up to ten expressions at the same time. Select the
expressions you want to be plotted together.
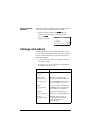
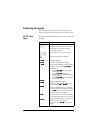
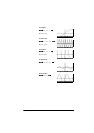
Setting up the plot (Plot view setup)
Press >6+,)7@SETUP-PLOT to define any of the settings shown
in the next two tables.
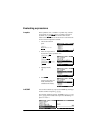
1. Highlight the field to edit.
– If there is a number to enter, type it in and press
>(17(5@ or .
– If there is an option to choose, press
, highlight
your choice, and press>(17(5@ or
. As a shortcut
to
, just highlight the field to change and press
>@ to cycle through the options.
– If there is an option to select or deselect, press
to check or uncheck it.
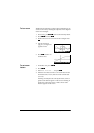
2. Press
to view more settings.
3. When done, press >3/27@ to view the new plot.
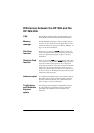
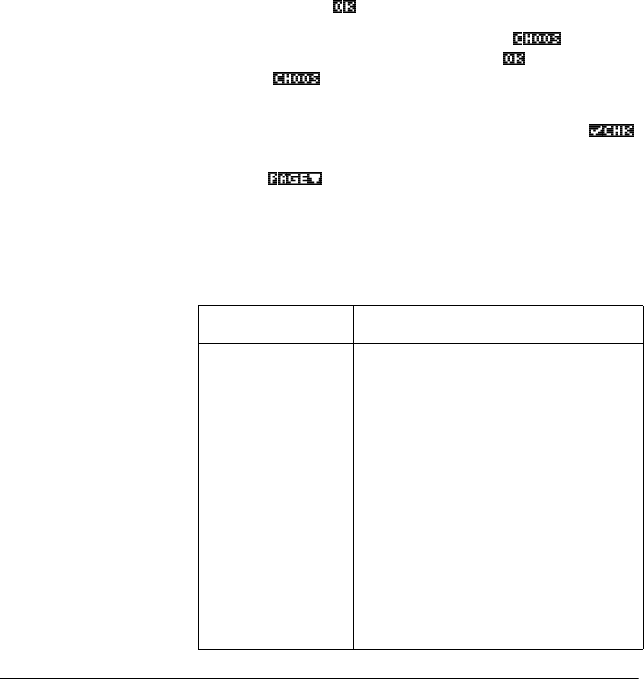
Plot view
settings
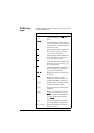
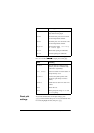
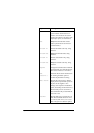
The plot view settings are:
Field Meaning
XRNG, YRNG Specifies the minimum and
maximum horizontal (X) and vertical
(Y) values for the plotting window.
RES For function plots: Resolution;
“Faster” plots in alternate pixel
columns; “Detail” plots in every
pixel column.
TRNG Parametric aplet: Specifies the t-
values (T) for the graph.
θRNG Polar aplet: Specifies the angle (θ)
value range for the graph.