


Statistics aplet 8-3
Choose fit and
data columns
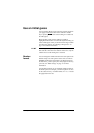
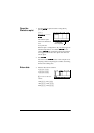
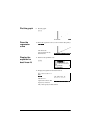
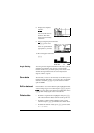
4. Select a fit in the Symbolic setup view.
>6+,)7@
SETUP-SYMB
*e,
Select Linear
You can define up to five explorations of two-variable
data, named S1 to S5. In this example, we will create
just one: S1.
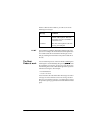
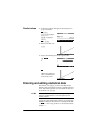
5. Specify the columns that hold the data you want to
analyze.
>6<0%@
You could have entered
your data into columns
other than C1 and C2.
Explore
statistics
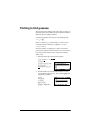
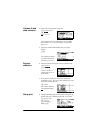
6. Find the mean advertising time (MEANX) and the mean
sales (MEANY).
>180@
MEANX is about 3.3
minutes and MEANY is
about $1796.
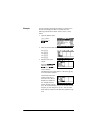
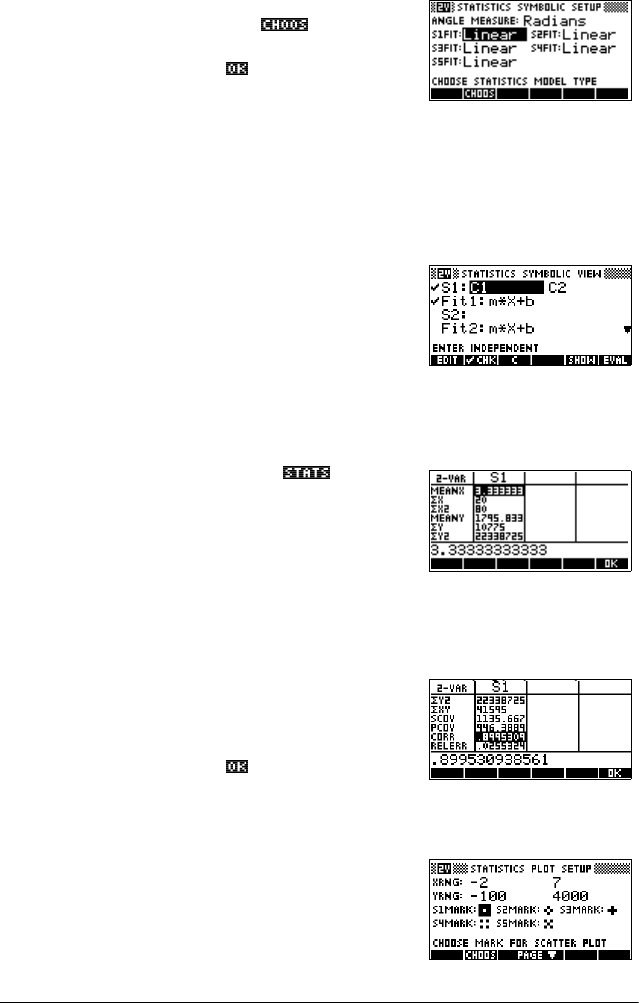
7. Scroll down to display the value for the correlation
coefficient (CORR). The CORR value indicates how well
the linear model fits the data.
*e,9 times
The value is 0.8995 to
four significant digits.
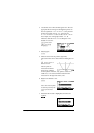
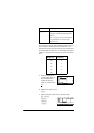
Setup plot 8. Change the plotting range to ensure all the data points are
plotted (and select a different point mark, if you wish).
>6+,)7@SETUP-PLOT
*A, 7 >(17(5@
>@ 100 >(17(5@
4000 >(17(5@