


10-12 Statistics aplet
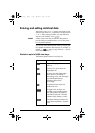
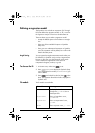
Defining a regression model
The Symbolic view includes an expression (Fit1 through
Fit5) that defines the regression model, or “fit”, to use for
the regression analysis of each two-variable data set.
There are three ways to select a regression model:
• Accept the default option to fit the data to a straight
line.
• Select one of the available fit options in Symbolic
Setup view.
• Enter your own mathematical expression in Symbolic
view. This expression will be plotted, but it will not be
fitted to the data points.
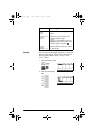
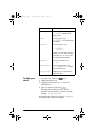
Angle Setting You can ignore the angle measurement mode unless your
Fit definition (in Symbolic view) involves a trigonometric
function. In this case, you should specify in the mode
screen whether the trigonometric units are to be
interpreted in degrees, radians, or grads.
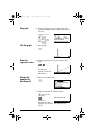
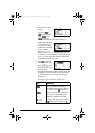
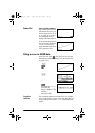
To choose the fit 1. In Numeric view, make sure is set.
2. Press
SETUP-SYMB to display the Symbolic Setup
view. Highlight the Fit number (S1FIT to S5FIT) you
want to define.
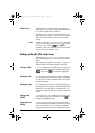
3. Press and select from the list. Press when
done. The regression formula for the fit is displayed in
Symbolic view.
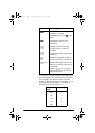
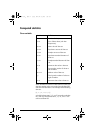
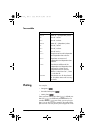
Fit models Ten fit models are available:
Fit model Meaning
Linear (Default.) Fits the data to a
straight line, y = mx+b. Uses a
least-squares fit.
Logarithmic Fits to a logarithmic curve,
y = m lnx + b.
Exponential Fits to an exponential curve,
y = be
mx
.
Power Fits to a power curve, y = bx
m
.
hp40g+.book Page 12 Friday, December 9, 2005 1:03 AM