


10-18 Statistics aplet
Relative Error The relative error is a measure of the error between
predicted values and actual values based on the specified
Fit. A smaller number means a better fit.
The relative error is stored in a variable named RELERR.
The relative error provides a measure of fit accuracy for
all fits, and it does depend on the Fit model you have
chosen.
HINT
In order to access the CORR and RELERR variables after
you plot a set of statistics, you must press to access
the numeric view and then to display the
correlation values. The values are stored in the variables
when you access the Symbolic view.
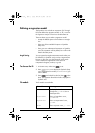
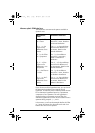
Setting up the plot (Plot setup view)
The Plot Setup view ( SETUP-PLOT) sets most of the
same plotting parameters as it does for the other built-in
aplets.
See “Setting up the plot (Plot view setup)” on page 2-5.
Settings unique to the Statistics aplet are as follows:
Plot type (1VAR) STATPLOT enables you to specify either a histogram or
a box-and-whisker plot for one-variable statistics (when
is set). Press to change the highlighted
setting
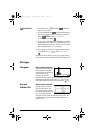
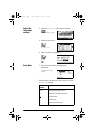
Histogram width HWIDTH enables you to specify the width of a histogram
bar. This determines how many bars will fit in the display,
as well as how the data is distributed (how many values
each bar represents).
Histogram range HRNG enables you to specify the range of values for a set
of histogram bars. The range runs from the left edge of the
leftmost bar to the right edge of the rightmost bar. You
can limit the range to exclude any values you suspect are
outliers.
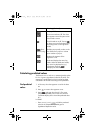
Plotting mark
(2VAR)
S1MARK through S5MARK enables you to specify one of
five symbols to use to plot each data set. Press to
change the highlighted setting.
Connected points
(2VAR)
CONNECT (on the second page), when checkmarked,
connects the data points as they are plotted. The resulting
line is not the regression curve. The order of plotting is
according to the ascending order of independent values.
hp40g+.book Page 18 Friday, December 9, 2005 1:03 AM