


Statistics aplet 10-17
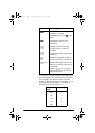
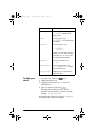
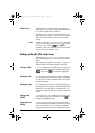
Scatter Plot Two-variable statistics.
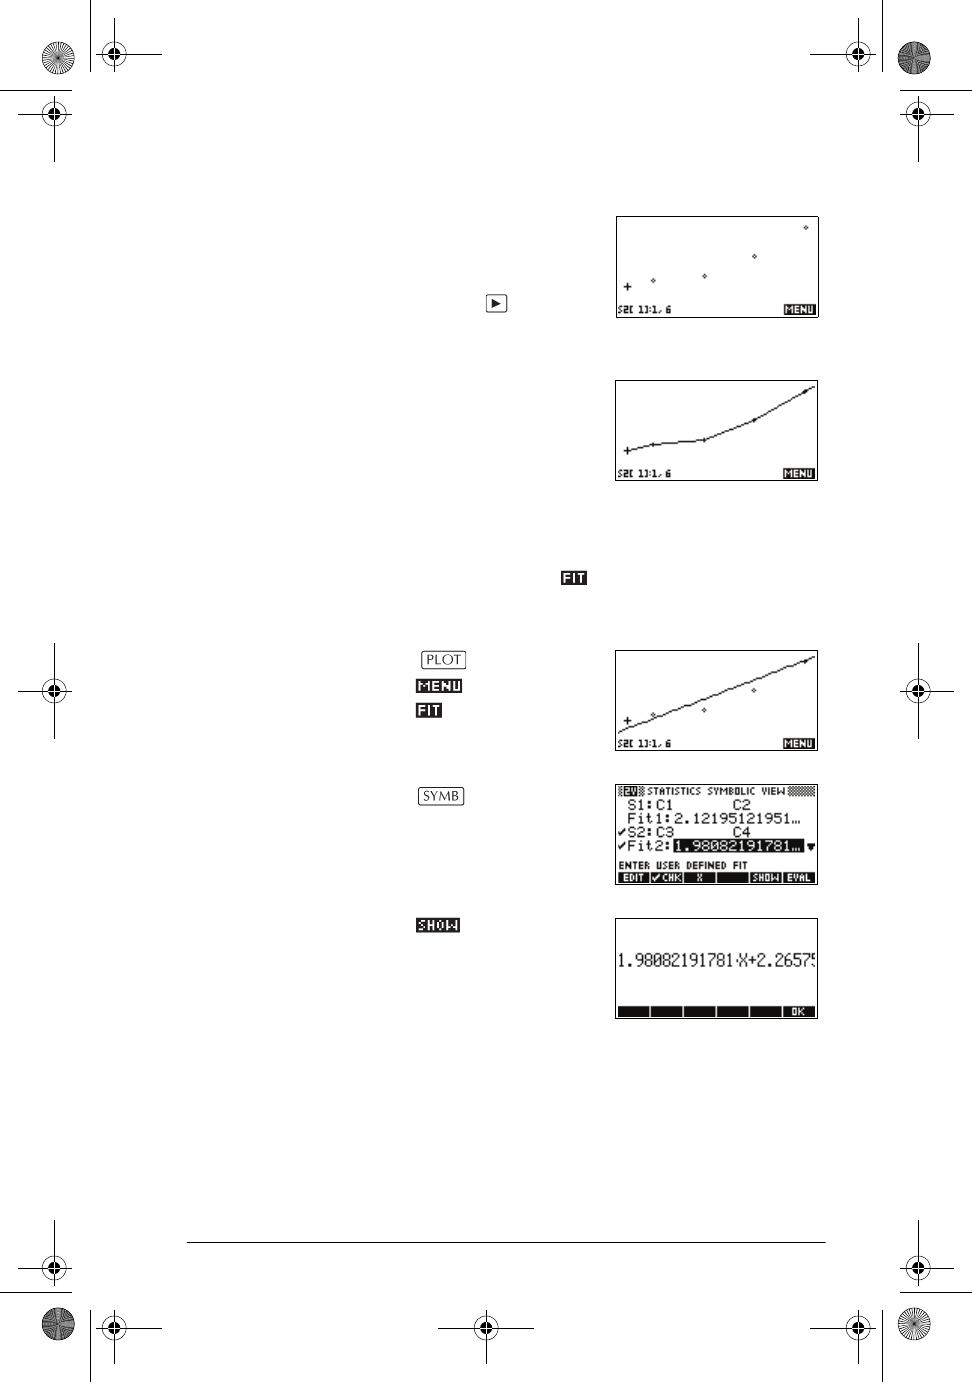
The numbers below the plot
indicate that the cursor is at
the first data point for S2, at
(1, 6). Press to move to
the next data point and
display information about it.
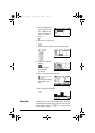
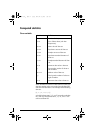
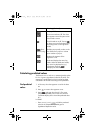
To connect the data points as
they are plotted, checkmark
CONNECT in the second
page of the Plot Setup. This is
not a regression curve.
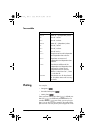
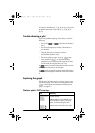
Fitting a curve to 2VAR data
In the Plot view, press . This draws a curve to fit the
checked two-variable data set(s). See “To choose the fit”
on page 10-12.
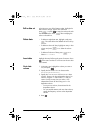
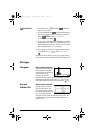
The expression in Fit2
shows that the
slope=1.98082191781
and the y-
intercept= 2.2657.
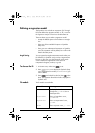
Correlation
coefficient
The correlation coefficient is stored in the CORR variable.
It is a measure of fit to a linear curve only. Regardless of
the Fit model you have chosen, CORR relates to the linear
model.
hp40g+.book Page 17 Friday, December 9, 2005 1:03 AM