


Parametric aplet 4-3
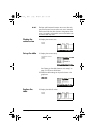
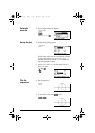
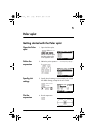
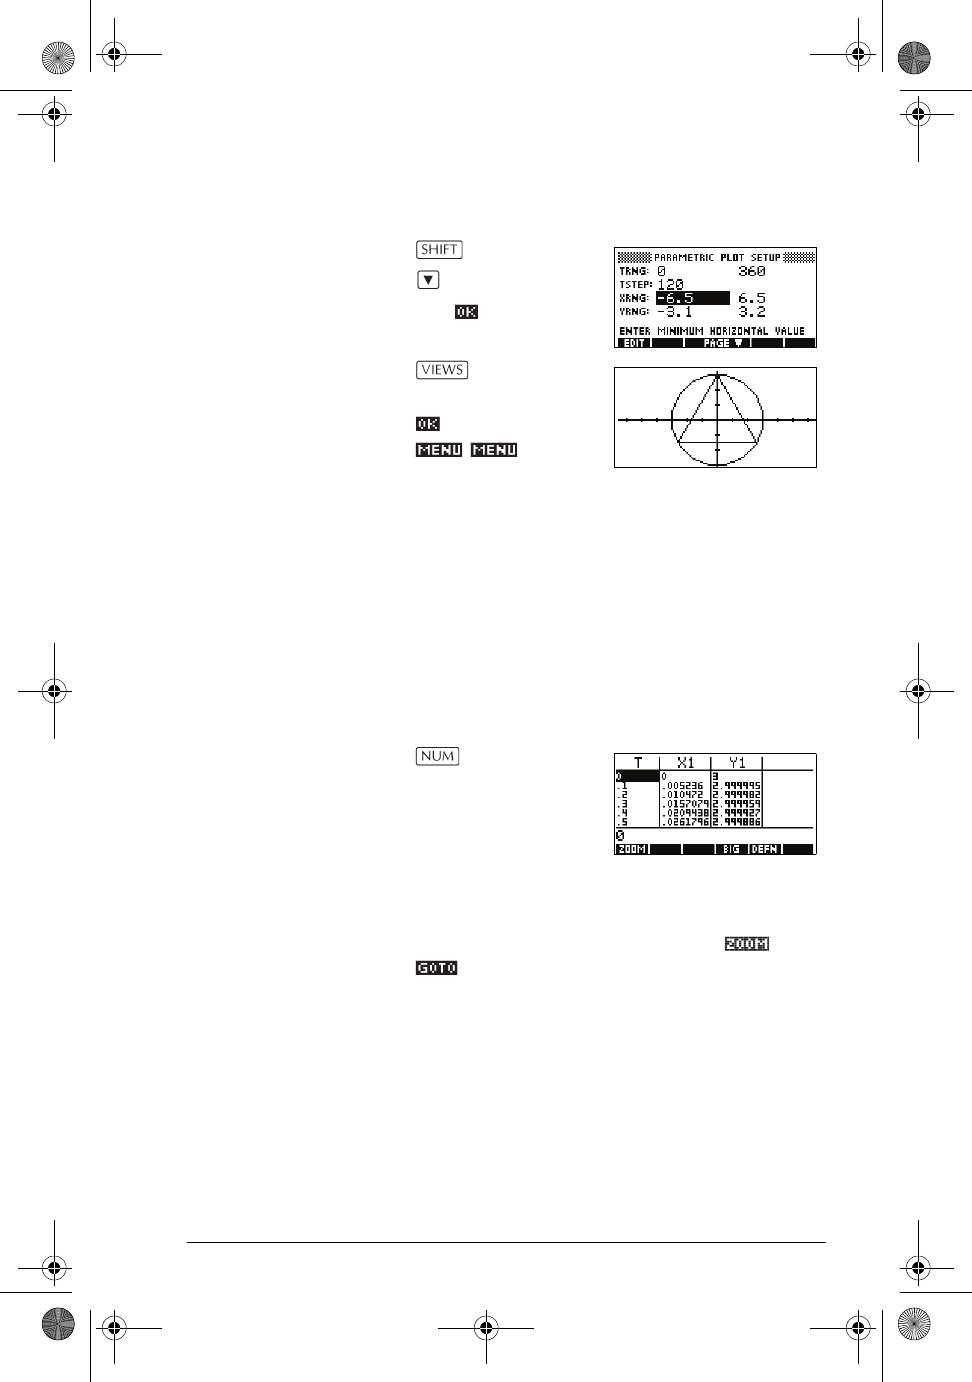
Overlay plot 8. Plot a triangle graph over the existing circle graph.
PLOT
120
Select Overlay Plot
A triangle is displayed
rather than a circle (without changing the equation)
because the changed value of TSTEP ensures that
points being plotted are 120° apart instead of nearly
continuous.
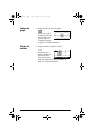
You are able to explore the graph using trace, zoom,
split screen, and scaling functionality available in the
Function aplet. See “Exploring the graph” on page 2-
7 for further information.
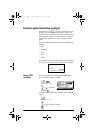
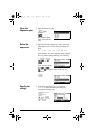
Display the
numbers
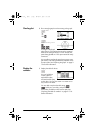
9. Display the table of values.
You can highlight a
t-value, type in a
replacement value,
and see the table jump
to that value. You can also zoom in or zoom out on
any t-value in the table.
You are able to explore the table using ,
, build your own table, and split screen
functionality available in the Function aplet. See
“Exploring the table of numbers” on page 2-17 for
further information.
hp40g+.book Page 3 Friday, December 9, 2005 1:03 AM