


Inference aplet 11-7
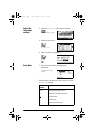
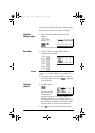
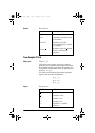
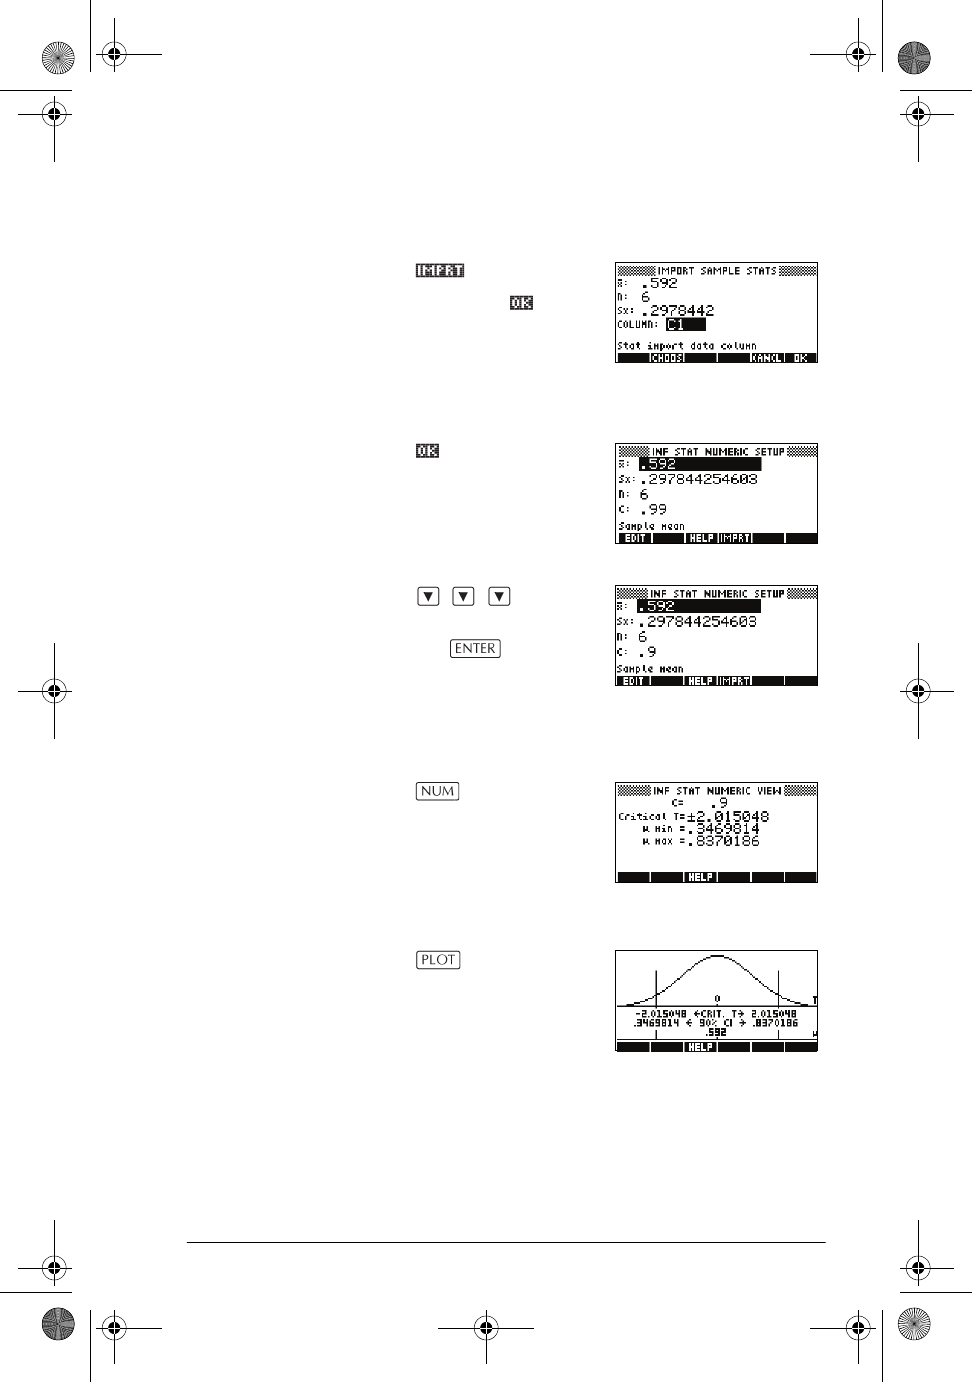
Import the data 10.Import the data from the Statistics aplet. Note: The
data from C1 is displayed by default.
Note: Press to see
the statistics before
importing them into the
Numeric Setup view.
Also, if there is more than one aplet based on the
Statistics aplet, you are prompted to choose one.
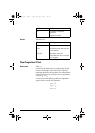
11.Specify a 90%
confidence interval in the C: field.
to move to
the C: field
0.9
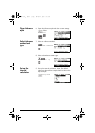
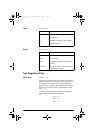
Display Numeric
view
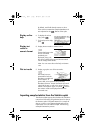
12.Display the confidence interval in the Numeric view.
Note: The interval setting is 0.5.
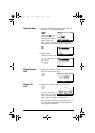
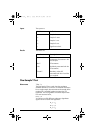
Display Plot
view
13.Display the confidence interval in the Plot view.
You can see, from the
second text row, that the
mean is contained within the 90% confidence
interval (CI) of 0.3469814 to 0.8370186.
Note: The graph is a simple, generic bell-curve. It is
not meant to accurately represent the t-distribution
with 5 degrees of freedom.
hp40g+.book Page 7 Friday, December 9, 2005 1:03 AM