


10-20 Statistics aplet
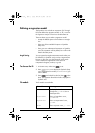
Calculating predicted values
The functions PREDX and PREDY estimate (predict) values
for X or Y given a hypothetical value for the other. The
estimation is made based on the curve that has been
calculated to fit the data according to the specified fit.
Find predicted
values
1. In Plot view, draw the regression curve for the data
set.
2. Press to move to the regression curve.
3. Press and enter the value of X. The cursor
jumps to the specified point on the curve and the
coordinate display shows X and the predicted value
of Y.
In HOME:
• Enter PREDX(y-value) to find the predicted
value for the independent variable given a
hypothetical dependent value.
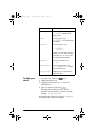
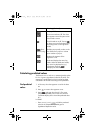
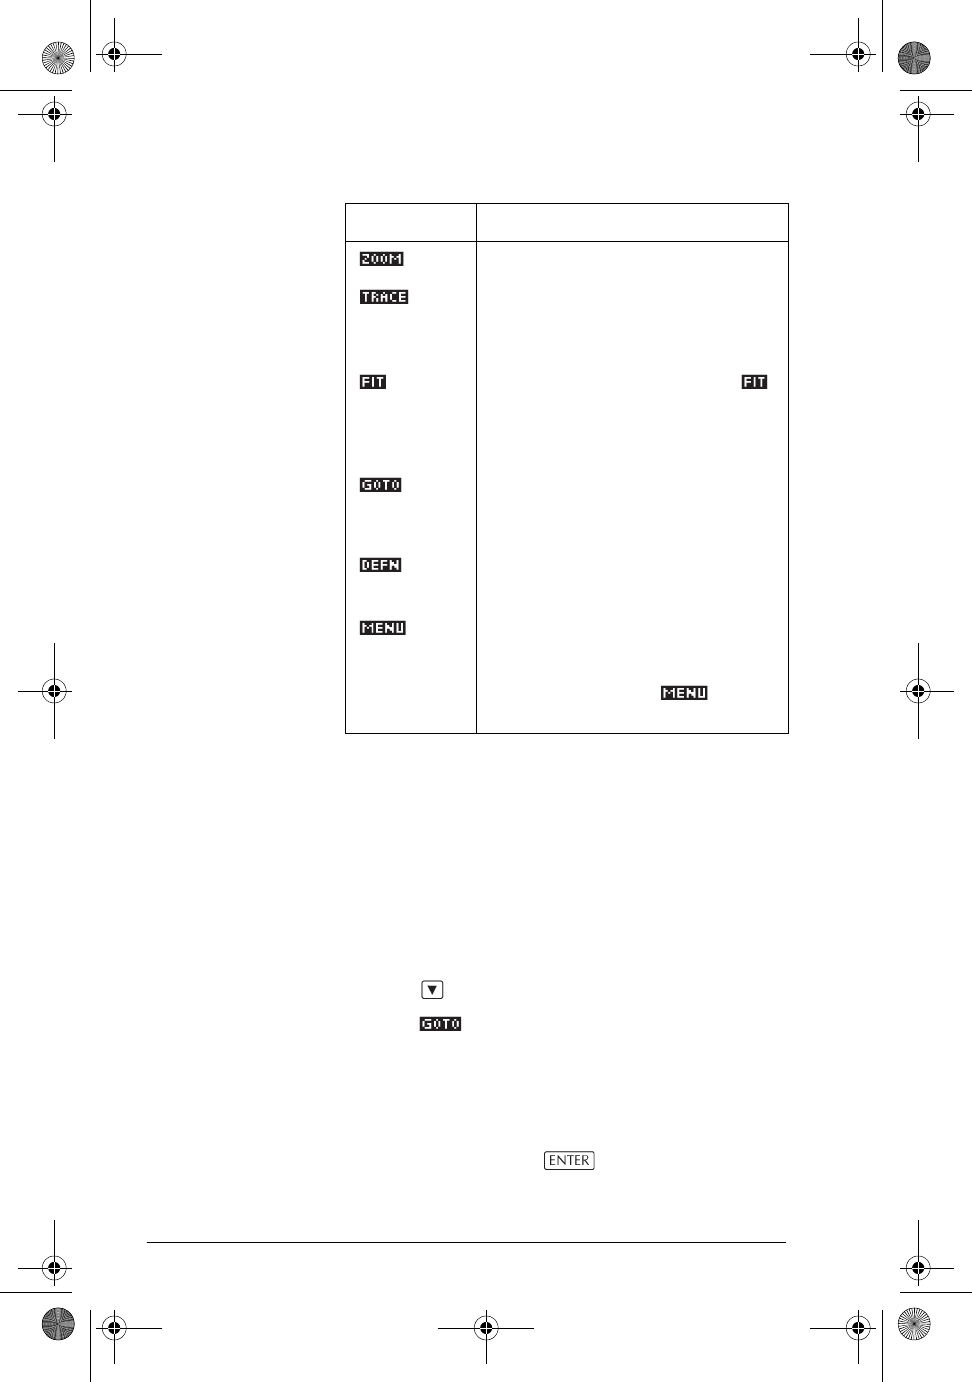
Displays ZOOM menu.
Turns trace mode on/off. The white
box appears next to the option when
Trace mode is active.
Turns fit mode on or off. Turning
on draws a curve to fit the data points
according to the current regression
model.
(2var
statistics only)
Enables you to specify a value on the
line of best fit to jump to or a data
point number to jump to.
Displays the equation of the
regression curve.
Hides and displays the menu key
labels. When the labels are hidden,
any menu key displays the (x,y)
coordinates. Pressing
redisplays the menu labels.
Key Meaning (Continued)
hp40g+.book Page 20 Friday, December 9, 2005 1:03 AM