


Network Cable Spe
cifications and Guidelines
When you calculate the power budget, you use a worst-case analysis to provide a margin of
error, even though all the parts of an actual system do not operate at the worst-case levels. To
calculate the
worst-case estimate of power budget (P
B
), you assume minimum t ransmitter
power (P
T
) and minimum receiver sensitivity (P
R
):
P
B
=P
T
–P
R
The following hypothetic a l power budget equation uses values measured in decibels (dB) and
decibels ref
erred to one milliwatt (dBm):
P
B
=P
T
–P
R
P
B
= –15 dBm – (–28 dBm)
P
B
=13dB
Calculating Power Margin for Fiber-Optic Cable
After calcul
ating a link’s power budget (using the equation described in “Calculating Power
Budget for Fiber-Optic Cable” on page 49), you can calculate the power margin (P
M
), which
represents the amount of power available after subtracting attenuation or link loss (LL)from
the power bu
dget (P
B
). A worst-case estimate of P
M
assumes maximum LL:
P
M
=P
B
–LL
A P
M
greater than zero indicates that the power budget is sufficient to operate the receiver.
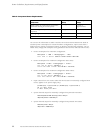
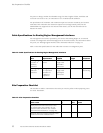
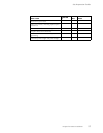
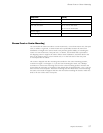
Factors tha
t can cause link loss include higher-order mode losses, modal and chromatic
dispersion, connectors, splices, and fiber attenuation. Table 12 lists an estimated amoun t of
loss for the factors used in the following sample calculations. For information about the actual
amount of si
gnal loss caused by equipment and other factors, refer to vendor documentation.
Table 12: Estimated Values for Factors Causing Link Loss
Link-Loss Factor Estimated Link-Loss Value
Higher-order mode losses Single-mode—None
Multimode—0.5 dB
Modal and chromatic dispersion Single-mode—None
Multimode—None, if product of bandwidth and
distance is less than 500 MHz–km
Connector
0.5 dB
Splice 0.5 dB
Fiber attenuation Single-mode—0.5 dB/km
Multimode
—1 dB/km
50 M5 and M10 Internet Routers Hardware Guide