


xSenso User Guide 59
10: Chart
Note: Lantronix recommends using the latest version of Chrome when viewing and
configuring the Chart tab.
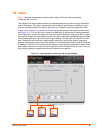
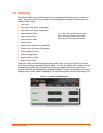
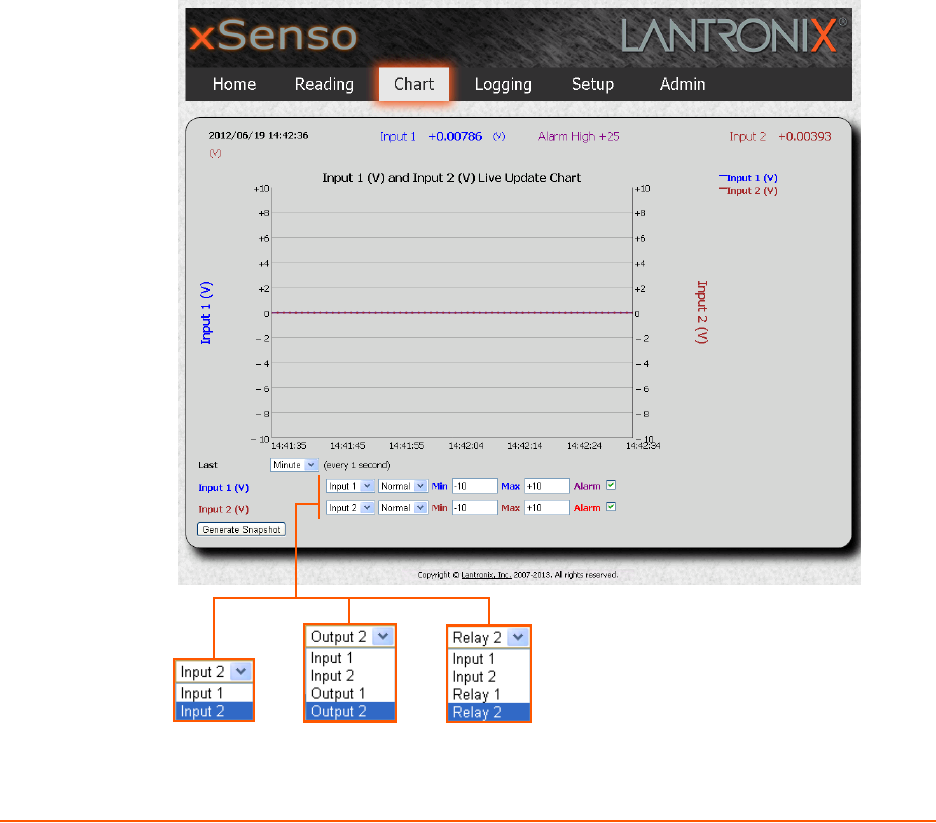
The xSenso Chart tab provides access to live charted analog input, output and relay information
on the Chart page. The chart is configurable and includes an optional alarm indication function.
Chart will poll data sample from xSenso every second. Titles and units are configurable under
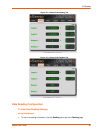
Analog Input, Analog Output and Relay Output settings (according to the xSenso device model;
see Figure 10-1). You can point your mouse over data point to see the actual reading presented
on the right side. You can also drag (press and hold mouse left button, drag across chart to see a
box and then release left mouse button) to zoom into chart. Note that zoomed data may get shifted
when the data expired in the current last time span setting. To reset zoom, double click on chart
area. Data polled will be stored in web browser's cache upon leaving the page or closing the
browser. Since browser stores cache per website, it is recommended to have a static IP, reserved
IP address in DHCP server or access unit by hostname. It is highly recommended to use the latest
web browser versions to run the chart. Running chart with IE8 or below will be very slow. Also, you
may need to update your graphic card drivers to optimize chart stability.
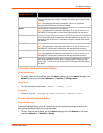
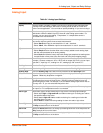
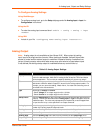
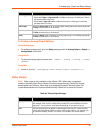
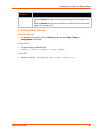
Figure 10-1 Charting Options in the Chart Tab by xSenso Model
xSenso 2100 xSenso 21A2 xSenso 21R2