


17: Maintenance and Diagnostics Settings
xSenso User Guide 98
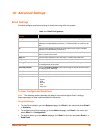
Traceroute
Here you can trace a packet from the xSenso to an Internet host, showing how many hops the
packet requires to reach the host and how long each hop takes. If you visit a web site whose
pages appear slowly, you can use traceroute to determine where the longest delays are occurring.
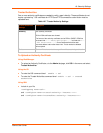
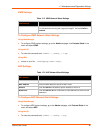
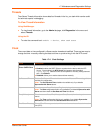
Table 17-9 Traceroute Settings
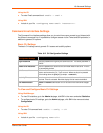
To Perform a Traceroute
Using Web Manager
To perform a Traceroute, go to the Admin tab/page, click Diagnostics in the menu and select
Traceroute.
Using the CLI
To enter the command level: enable
Using XML
Not applicable.
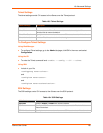
Log
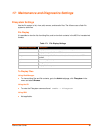
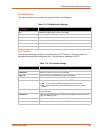
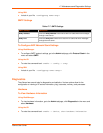
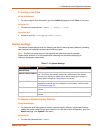
Table 17-10 Log Settings
To Configure the Diagnostic Log Output
Using Web Manager
To configure the Diagnostic Log output, go to the Admin tab/page, click Diagnostics in the
menu and select Log.
Using the CLI
To enter the command level: enable -> config -> diagnostics -> log
Diagnostics:
Traceroute Settings
Description
Host Enter the IP address or DNS hostname. This address is used to show the path
between it and the xSenso when issuing the traceroute command.
Protocol Specify the traceroute protocol.
Diagnostics: Log Description
Output Select a diagnostic log output type:
Disable - Turn off the login feature.
Filesystem - Directs logging to /log.txt.
Max Length Set the maximum length of the log.txt file.
Note: This setting becomes available when Filesystem is selected.