10. Setting Up NetScout Manager Plus for FrameSaver Devices
9128-A2-GB20-80 September 2002
10-19
Procedure
1. Select the Traffic radio button to monitor the newly added agent, or one of its
DLCIs.
2. Highlight an agent in the agent list box so that its DLCIs appear in the DLCI list
box (under the agent list box).
3. If you want to monitor one of the agent’s DLCIs, highlight the DLCI to be
monitored.
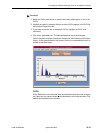
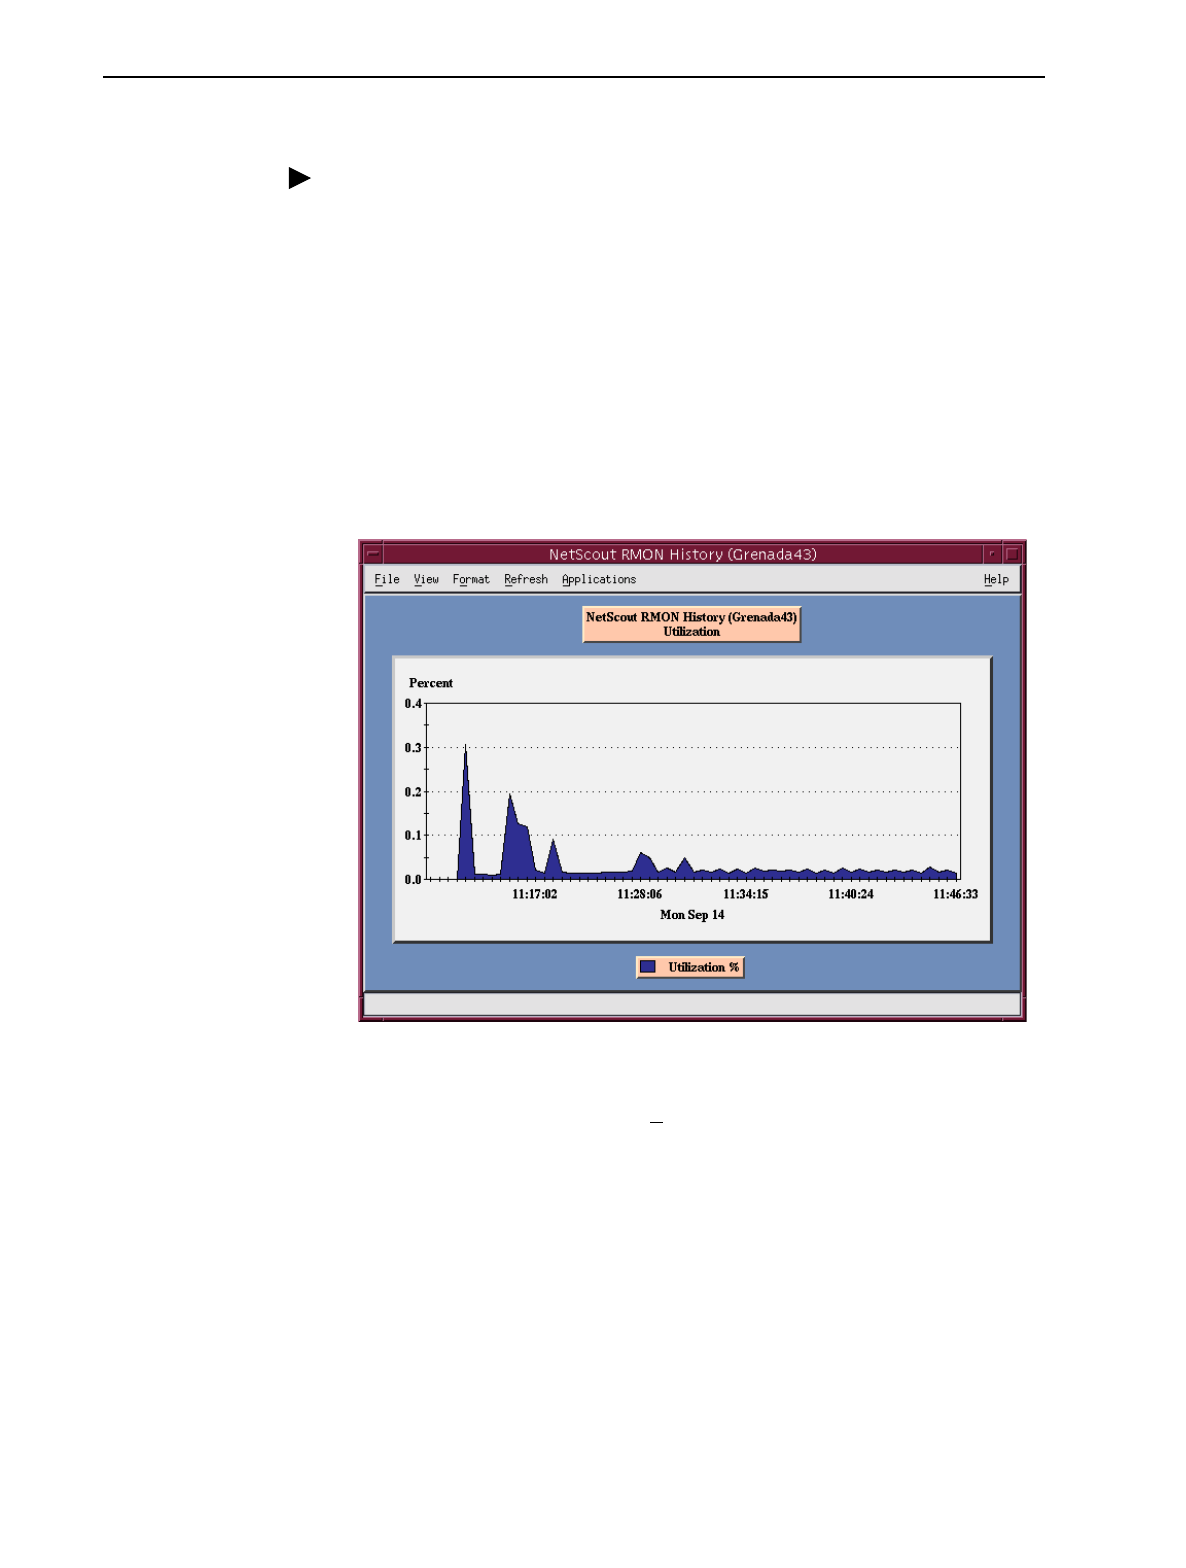
4. Click on an applicable icon. The selected graphical report should open.
Traffic icons that would be of particular interest are Traffic Monitor and Domain
History. In the example below, the Domain History icon was selected, which is
actually a real-time report.
NOTE:
If Size Distribution is the selected View and distribution size has been changed
via OpenLane, the values shown for the distribution will not be accurate. Only
default size distributions are tracked.


