


Verifying System Functionality 3
Installation and User’s Guide 99
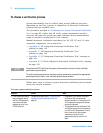
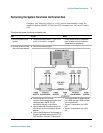
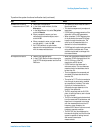
13 Make the DC and RF
measurements in IC-CAP.
a Reconnect the attenuator.
b In the Atten model window, click the
Macros tab.
c In the Select Macro: list, select Tes t_ at ten
and click Execute.
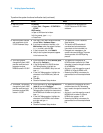
d When prompted to ensure you have
calibrated the network analyzer, enter Y
and click OK.
e When prompted to enter a cal set number
use the default (1) and click OK.
f As IC-CAP performs an optimization,
observe the simulated data trace converge
with the measured data trace.
• This opens the Atten model window’s
Macros tab folder.
• This starts a sequence of prompts and
responses.
• IC-CAP performs measurements of the
attenuator’s DC and RF parameters.
• When complete, IC-CAP displays plots
of the forward and reverse DC voltage
transfer through the attenuator. The
solid line is the measured data, the
dashed line is the simulated data.
• IC-CAP begins the optimization process
using default simulated data. These
values are optimized to converge with
the measured data.
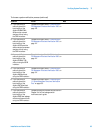
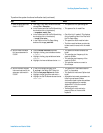
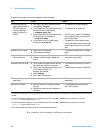
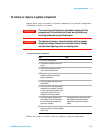
14 Interpret the results. a Observe the displayed plots.
b In the IC-CAP/Status window, observe the
final DC/RF values parameter and the Final
RMS error.
• When the S-parameter measurement is
complete, IC-CAP displays plots of the
S12/21, 20×log
10
of the S21
magnitude, and S21 phase.
**
• IC-CAP also lists the attenuator’s
resistance values. The error between
measured and simulated data should
be less than 2%.
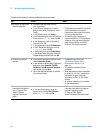
• The error between the measured and
simulated S21 phase data should be
less than 2%.
• The value for T1.TD is the transmission
time through the attenuator, modeled
as transmission line delay. This value
(typically in the femtosecond to
nanosecond range) depends on the
length of the attenuator.
• The S21 magnitude and the S12/S21
plots, of less significance, are included
for your interest.
• The S21 simulated trace is determined
from the measured DC resistances, and
therefore is not expected to converge
with the measured data over the full
frequency range. However, the
measured S21 data will show a normal
frequency response variation.
• The S12/S21 plot (also displayed on
the network analyzer) confirms that the
system is capable of making forward
and reverse transmission
measurements.
To perform the system functional verification test (continued)
Step Action Notes