Monitoring Hub Performance 2-31
Using the FRX4000, FRX6000, and SmartSwitch 1800 Hub View
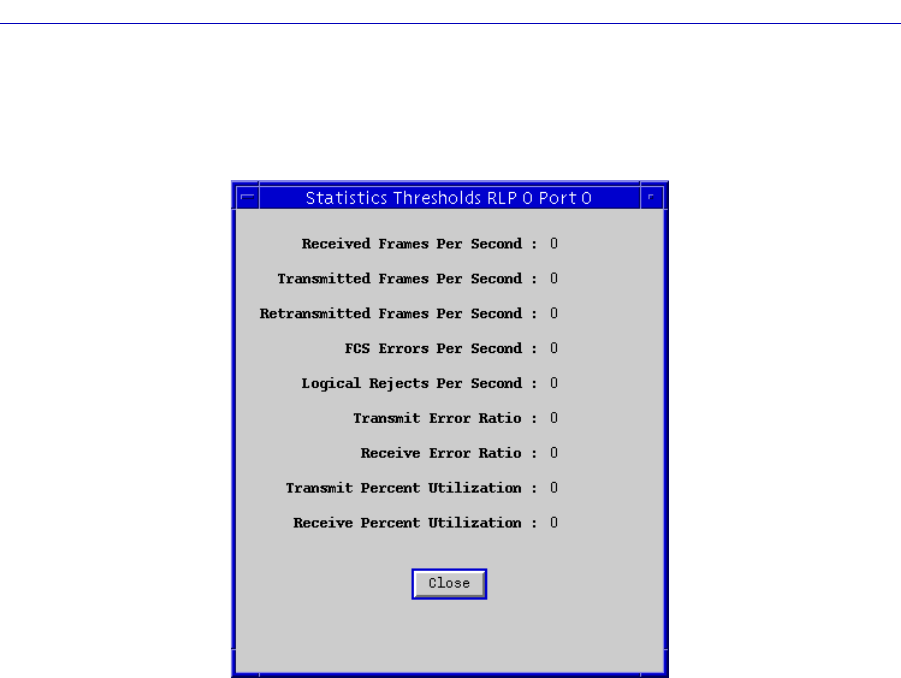
2. Drag down to Thresholds, and release. The Port Statistics Thresholds
window, Figure 2-16, will appear.
Figure 2-16. The Port Statistics Thresholds Window
The Port Statistics Thresholds window shows the current threshold value (either a
number or a percentage) for the following Port health statistics (for deÞnitions of
the Port Health Statistics, see Serial Port Health, page 2-26):
Received Frames Per Second Shows the threshold for the Frames Received
statistic.
Transmitted Frames Per Second Shows the threshold for the Frames
Transmitted statistic.
Retransmitted Frames Per Second Shows the threshold for the Frames
Retransmitted statistic.
FCS Errors Per Second Shows the threshold for the FCS Errors
statistic.
Logical Rejects Per Second Shows the threshold for the Logical Rejects
statistic.
Transmit Error Ratio Shows the threshold for the Transmit Error
Ratio statistic. This statistic is the ratio of
retransmitted frames per second to
successfully transmitted frames per second
on the port.
