3-16 Installation and Troubleshooting Guide
C — copper
,
Pressing <Enter> while Port Throughput is selected displays the port throughput on
the switch. The throughput number represents the number of bytes received plus the
number of bytes transmitted per second and is displayed in bytes/second (B/s), kilo-
bytes/second (KB/s) or megabytes/second (MB/s). You can select different ports using
<Up> and <Down>, from port 0 to port 15 and all ports, and is used to monitor a sin-
gle or the aggregate of all port(s) performance.
Pressing <Enter> while Temperature is selected displays the temperatures at the
temperature sensors on the motherboard. The temperature readings are shown at a
rate of one reading per second on the front panel. Reading obtained during a Te l n e t
session are single readings made at command execution.
2
Pressing <Enter> while Error Log is selected displays the following information:
Error number (01-64)
Date and time of the last occurrence each error type was sensed
Total number of occurrences of each error type
Error type
Error level for each error type, with error level 1 being the most critical; error
level 2, error level 3, and warning, are the other error levels displayed.
— 0: Panic (When this level is reached, the switch automatically reboots and
the display no longer shows the error.)
— 1: Critical
— 2: Error
— 3: Warning
— 4: Info
— 5: Debug
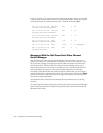
An example status might be:
)! !,!-.
(#(#%/)012(3-
In the example, the first line shows that this is the first error (01) found on Feb 12
08:48:29 and had (23) occurrences. The second line shows that the error type is
SENSOR-FAILED with a sensitivity level of 3 (warning).
NOTE: The error occurrences count, shown in parentheses at the end of the first
line, does not appear until the error occurrence is higher than one.


