


RiverMaster Administrator’s Guide 175
Chapter 7
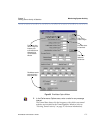
Viewing Tunnel Activity
Viewing Server Activity & Statistics
4
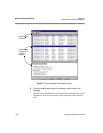
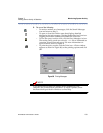
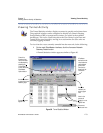
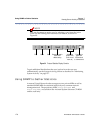
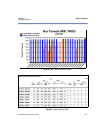
Using the controls shown in Figure 91, control the graph display as
follows:
– To start and stop the display, use the Play and Stop buttons.
– To temporarily freeze the display to examine activity at a specific
point in time, use the Pause button.
– To clear the display and restart the graph, use the Reset button.
– To adjust the scale to closely examine an individual graph or pull
back to view all graphs, use the Zoom In and Zoom Out buttons.
– To view the graphs as 3-dimensional objects rather than simply
2-dimensional lines, place a check next to 3D.
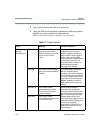
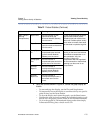
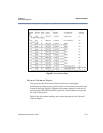
GRE (Generic
Routing
Encapsulation)
Bytes Rcvd The total number of GRE
bytes received by the
Aurorean Network Gateway
over the tunnel.
These values describe the actual
payload data (without packet
headers) sent and received over
the tunnel. Sudden spikes usually
occur when a remote client starts
to download or upload a large file.
Bytes Sent The total number of GRE
bytes sent to the remote client
over the tunnel.
Compression Comp Bytes
In
The total number of
compressed bytes received
by the Aurorean Network
Gateway over the tunnel.
The values show the level of
activity on the tunnel and indicate
how effective compression is on
this connection. Very low
numbers indicate that
compression was not negotiated
for this connection or that the data
passing over the tunnel is not
compressible.
Comp Bytes
Out
The total number of
compressed bytes sent to the
remote user over the tunnel.
Uncomp
Bytes In
The total number of
uncompressed bytes received
by the Aurorean Network
Gateway over the tunnel.
Uncomp
Bytes Out
The total number of
uncompressed bytes sent to
the remote user over the
tunnel.
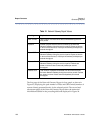
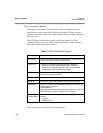
Table 12 Protocol Statistics (Continued)
Value Meaning Trends to Look For...