


180 RiverMaster Administrator’s Guide
Report Contents
Chapter 8
Generating Reports
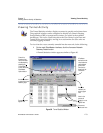
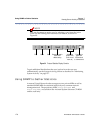
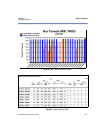
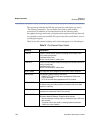
The first page of the Network Gateway Report is a bar graph, as shown in
Figure 93, displaying the peak number of IPSec and GRE tunnels (number of
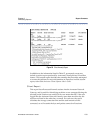
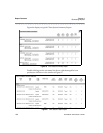
remote clients) generated hourly for the selected period. The second and
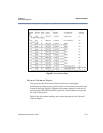
subsequent pages of the Network Gateway Report show the numerical
information detailed in the preceding table and displayed in Figure 94.
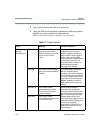
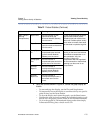
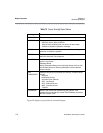
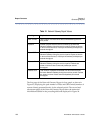
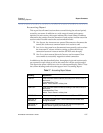
Table 14 Network Gateway Report Values
Heading Explanation
Max Tunnels Total number of remote clients that connected during the one-
hour period.
Bytes IN Number of bytes received over all tunnels by the Aurorean
Network Gateway during the one-hour period. Bytes are shown
in terms of total counts (in 1000 byte increments) and bytes per
second throughput.
Bytes OUT Number of bytes transmitted over all tunnels from the Aurorean
Network Gateway during the one-hour period. Bytes are shown
in terms of total counts (in 1000 byte increments) and bytes per
second throughput.
Packets IN Number of packets received over all tunnels by the Aurorean
Network Gateway during the one-hour period. Packets are
shown in terms of total counts and packets per second
throughput.
Packets OUT Total number of packets transmitted over all tunnels from the
Aurorean Network Gateway during the one-hour period. Packets
are shown in terms of total counts and packets per second
throughput.