


104
CHAPTER 5
Intel® NetStructure™ 470T and 470F Switches User Guide
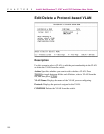
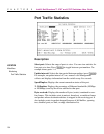
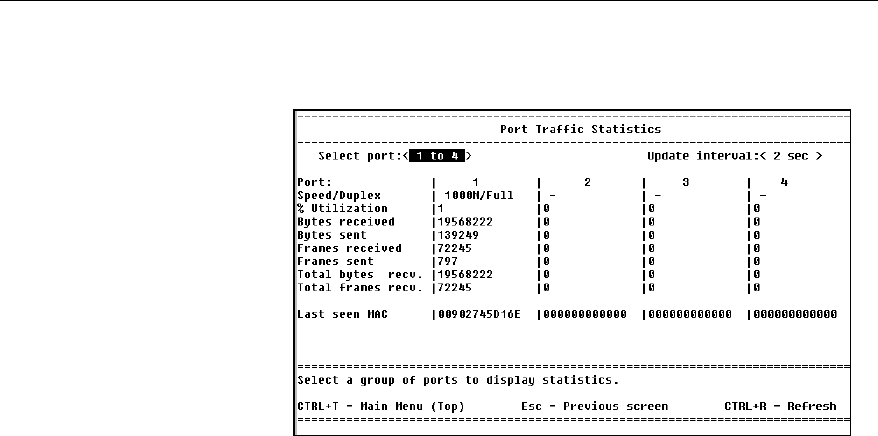
Port Traffic Statistics
Description
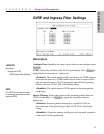
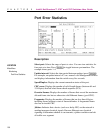
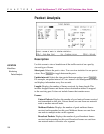
Select port: Selects the range of ports to view. You can view statistics for
four ports at a time. Press z to toggle between port numbers. The
example shows ports 1–4.
Update interval: Selects the time period between updates (press z).
For example, an update interval of 5 sec. means Local Management
collects and displays information from the switch every five seconds.
Speed/Duplex: Displays the current connection status of the port.
% Utilization: Displays the percentage of Ethernet bandwidth (100Mbps
or 1000Mbps) used by the device attached to that port.
Bytes received: Displays the number of bytes (octets) contained in error-
free frames. This includes octets in unicast, broadcast, or multicast frames
and packets whose destination address is mapped to the receiving port. It
also includes octets in packets dropped because of full buffers, spanning
tree, disabled ports, no link, or empty distribution list.
LOCATION
Main Menu
Monitoring
Port Traffic Statistics