


26
CHAPTER 3
Intel
®
NetStructure™ 470T and 470F Switches User Guide
• Group 1 (Statistics): Monitors utilization and error statistics for each
network segment (100Mbps or 1000Mbps).
• Group 2 (History): Records periodic statistical samples from variables
available in the statistics group.
• Group 3 (Alarms): Allows you to set a sampling interval and alarm
thresholds for statistics. When a threshold is passed, the switch creates an
event. For example, you might set an alarm if utilization exceeds 30%.
• Group 9 (Events): Provides notification and tells the switch what to do
when an event occurs on the network. Events can send a trap to a
receiving station or place an entry in the log table, or both. For example,
when the switch experiences an RMON Event, it sends out an alarm.
The switch also keeps a log that shows a list of the RMON Events and
RMON Alarms that have occurred on the switch.
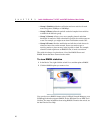
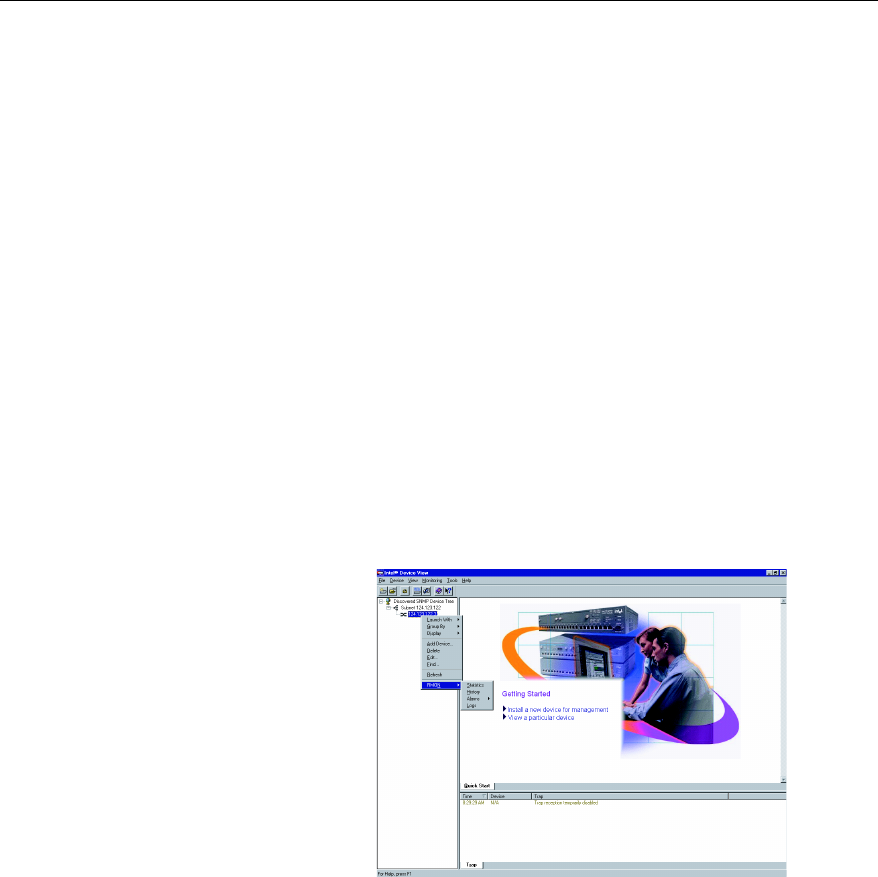
To view RMON statistics
1 In the Device Tree, right-click the switch’s icon, and then point to RMON.
2 Click the RMON option you want to view.
You can also access RMON features using LANDesk Network Manager, or an
SNMP application that supports RMON such as HP OpenView or IBM Tivoli
NetView. For more information about using RMON to monitor the switch, see
the Intel Device View Help.