107
12. Appendix E: Profibus-DP Data and Diagnostics
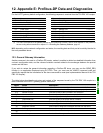
For the LUFP7 gateway default configuration, the following response is received from the TSX PBY 100 coupler:
Bytes Name Value Bytes Name Value
0-1 Total length
16#0019
14 Group Flags
16#00
2 Number of %IW
16#10
15 Address ID (1)
16#02
3 Number of %QW
16#10
16 Modular slave
16#01
4-5 %IW offset
16#0000
17 Active slave
16#01
6-7 %QW offset
16#0000
18-19 Settings size
16#0000
8 Station Status
16#38
20-21 Configuration data size
16#0001
9 Watchdog Factor 1
16#14
22-23 Size of the data used
16#0000
10 Watchdog Factor 2
16#01
—— Settings
———————
11 Min TSDR
16#0B
24 Configuration data
16#7F
12-13 PNO_Identifier
16#071F
—— Data used
———————
(1) This value corresponds to the gateway address on the Profibus-DP network, and its value depends on the position of
the two coding wheels described in chapter 2.7.1 Encoding the Gateway Address, page 22.
N.B. depending on the network configuration and status, the resulting data are likely not to be strictly identical to
the ones presented above.
12.3. General Gateway Information
Another command, also sent to a Profibus-DP master, makes it possible to obtain less detailed information than
a slave's configuration data, and the values of statistic counters related to the exchanges between the queried
master and the slave.
If you wish to review the general information regarding a Profibus-DP slave, you may use the SEND_REQ
function in an application developed using PL7 PRO. Then, you must use the 16#0031 command code and
specifically request that the information for the slave concerned be read (see
Implementation Manual of the TSX
PBY 100 coupler).
The table below describes the structure and content of the response issued by the TSX PBY 100 coupler to a
read command of the LUFP7 gateway general information:
Bytes Name Description
0
Configured 16#01 if the slave was configured in accordance with Profibus
1
Operating 16#01 if the slave has been set up and operates properly
2-3
Number of %IW Total size (words) of the input data in the %IW area
4-5
Number of %QW Total size (words) of the output data in the %QW area
6
Input data size Total size (bytes) of the input data on Profibus
7
Output data size Total size (bytes) of the output data on Profibus
8
Diagnostic data size Total size (bytes) of the first diagnostic received
9
Compact diagnostic Compact diagnostic data for that slave
10
Diagnostic counter Total number of diagnostic messages received from that slave
11
Exchange counter Number of exchanges between the master and this defective slave
12
Unavailability counter Number of times this slave is present but unavailable
13
Invalid response counter Number of invalid responses for this slave


