


Chapter 9 Dashboard
ZyWALL USG 1000 User’s Guide
216
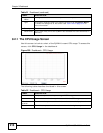
9.2.1 The CPU Usage Screen
Use this screen to look at a chart of the ZyWALL’s recent CPU usage. To access this
screen, click CPU Usage in the dashboard.
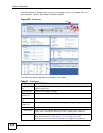
Figure 209 Dashboard > CPU Usage
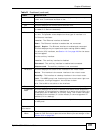
The following table describes the labels in this screen.
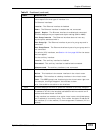
Signature
Name
The signature name identifies a specific intrusion pattern.
Type This column displays when you display the entries by Signature Name.
It shows the categories of intrusions. See Table 154 on page 574 for
more information.
Severity This is the level of threat that the intrusions may pose.
Occurrence This is how many times the ZyWALL has detected the event described in
the entry.
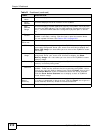
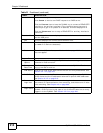
Table 21 Dashboard (continued)
LABEL DESCRIPTION
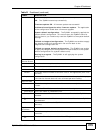
Table 22 Dashboard > CPU Usage
LABEL DESCRIPTION
The y-axis represents the percentage of CPU usage.
The x-axis shows the time period over which the CPU usage occurred
Refresh
Interval
Enter how often you want this window to be automatically updated.
Refresh Click this to update the information in the window right away.