CSX200 and 400 Chassis View
2-14 Managing the Device
Physical Status
Displays the current physical status Ñ or operational state Ñ of the interface:
Online or Ofßine.
Logical Status
Displays the current logical status Ñ or administrative state Ñ of the interface:
Up or Down.
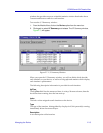
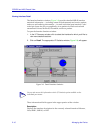
Interface Performance Statistics/Bar Graphs
The statistical values (and, where available, the accompanying bar graphs) in the
far-right columns of the I/F Summary window provide a quick summary of
interface performance. You can select the statistical value you want to display and
the units in which you want those values displayed by using the two menu Þelds
directly above the interface display area, as follows:
1. In the right-most menu field, click on the down arrow and select the unit in
which you wish to display the selected statistic: Load, Raw Counts, or Rate.
2. Once you have selected the base unit, click on the down arrow in the left-most
field to specify the statistic you’d like to display. Note that the options available
from this menu will vary depending on the base unit you have selected.
After you select a new display mode, the statistics (and graphs, where applicable)
will refresh to reßect the current choice, as described below.
Raw Counts
The total count of network trafÞc received or transmitted on the indicated
interface since device counters were last reset. Raw counts are provided for the
following parameters:
In Octets Octets received on the interface, including framing
characters.
In Packets Packets (both unicast and non-unicast) received by the
device interface and delivered to a higher-layer protocol.
In Discards Packets received by the device interface that were
discarded even though no errors prevented them from
being delivered to a higher layer protocol (e.g., to free up
buffer space in the device).
NOTE
Bar graphs are only available when Load is the selected base unit; if you select Raw
Counts or Rate, the Bar Graph column will be removed from the interface display.


