


Bridging
4-22 Bridge Statistics
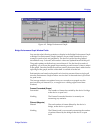
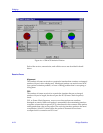
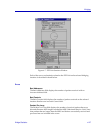
Statistics Window Fields
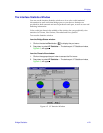
The following informational and statistics Þelds appear in the interface Statistics
window.
Three informational Þelds appear in the upper portion of the window:
Description
Describes the interface description for the currently selected port.
Address
Displays the MAC (physical) address of the selected port.
Type
Displays the interface type of the selected port.
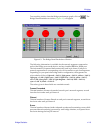
The following transmit and receive statistics Þelds are displayed in the lower
portion of the window. The Þrst four statistics are also graphically displayed in a
pie chart. The statistics are read directly from the device, and are updated with
each poll from SPECTRUM Element Manager to the device.
Unicast
Displays the number of packets transmitted to, or received from, this interface
that had a single, unique source or destination address. These statistics are
displayed in the pie chart (color-coded green).
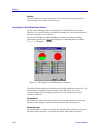
Non-Unicast
Displays the number of packets transmitted to, or received from, this interface
that had a source or destination address that is recognized by more than one
device on the network segment. The non-unicast Þeld includes a count of
broadcast packetsÑthose that are recognized by all devices on a segment. These
statistics are displayed in the pie chart (color-coded dark blue).
Discarded
Displays the number of packets which were discarded even though no errors
were detected to prevent transmission. One possible reason for discarding such a
packet could be to free up buffer space.
Discarding good packets indicates a very busy network. If a device routinely
discards packets, it usually means that network trafÞc is overwhelming the
device, perhaps because the device is performing poorly.
These statistics are displayed in the pie chart (color-coded hot pink).
Error
Displays the number of packets received or transmitted that contained errors.
These statistics are displayed in the pie chart (color-coded red).