


show platform hardware capacity
CF-800
Cisco IOS Configuration Fundamentals Command Reference
July 2008
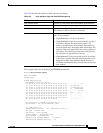
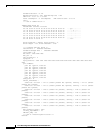
The show platform hardware capacity cpu command displays the following information:
• CPU utilization for the last 5 seconds (busy time and interrupt time), the percentage of the last
1-minute average busy time, and the percentage of the last 5-minute average busy time.
• Processor memory total available bytes, used bytes, and percentage used.
• I/O memory total available bytes, used bytes, and percentage used.
The show platform hardware capacity eobc command displays the following information:
• Transmit and receive rate
• Packets received and packets sent
• Dropped received packets and dropped transmitted packets
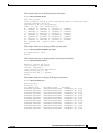
The show platform hardware capacity forwarding command displays the following information:
• The total available entries, used entries, and used percentage for the MAC tables.
• The total available entries, used entries, and used percentage for the FIB TCAM tables. The display
is done per protocol base.
• The total available entries, used entries, and used percentage for the adjacency tables. The display
is done for each region in which the adjacency table is divided.
• The created entries, failures, and resource usage percentage for the NetFlow TCAM and ICAM
tables.
• The total available entries and mask, used entries and mask, reserved entries and mask, and entries
and mask used percentage for the ACL/QoS TCAM tables. The output displays the available, used,
reserved, and used percentage of the labels. The output displays the resource of other hardware
resources that are related to the ACL/QoS TCAMs (such as available, used, reserved, and used
percentage of the LOU, ANDOR, and ORAND).
• The available, used, reserved, and used percentage for the CPU rate limiters.
The show platform hardware capacity interface command displays the following information:
• Tx/Rx drops—Displays the sum of transmit and receive drop counters on each online module
(aggregate for all ports) and provides the port number that has the highest drop count on the module.
• Tx/Rx per port buffer size—Summarizes the port-buffer size on a per-module basis for modules
where there is a consistent buffer size across the module.
The show platform hardware capacity monitor command displays the following SPAN information:
• The maximum local SPAN sessions, maximum RSPAN sessions, maximum ERSPAN sessions, and
maximum service module sessions.
• The local SPAN sessions used/available, RSPAN sessions used/available, ERSPAN sessions
used/available, and service module sessions used/available.
The show platform hardware capacity multicast command displays the following information:
• Multicast Replication Mode: ingress and egress IPv4 and IPv6 modes.
• The MET table usage that indicates the total used and the percentage used for each module in the
system.
• The bidirectional PIM DF table usage that indicates the total used and the percentage used.
The show platform hardware capacity system command displays the following information:
• PFC operating mode (PFC Version: PFC3A, PFC3B, unknown, and so forth)
• Supervisor redundancy mode (RPR, RPR+, SSO, none, and so forth)