


show processes
CF-833
Cisco IOS Configuration Fundamentals Command Reference
July 2008
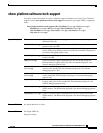
Note Because platforms have a 4- to 8-millisecond clock resolution, run times are considered reliable only
after a large number of invocations or a reasonable, measured run time.
For a list of process descriptions, see http://www.cisco.com/warp/public/63/showproc_cpu.html.
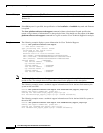
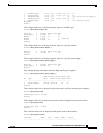
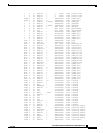
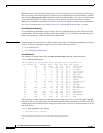
The following is sample output from the show processes history command:
Router# show processes history
PID Exectime(ms) Caller PC Process Name
3 12 0x0 Exec
16 0 0x603F4DEC GraphIt
21 0 0x603CFEF4 TTY Background
22 0 0x6042FD7C Per-Second Jobs
67 0 0x6015CD38 SMT input
39 0 0x60178804 FBM Timer
16 0 0x603F4DEC GraphIt
21 0 0x603CFEF4 TTY Background
22 0 0x6042FD7C Per-Second Jobs
16 0 0x603F4DEC GraphIt
21 0 0x603CFEF4 TTY Background
22 0 0x6042FD7C Per-Second Jobs
67 0 0x6015CD38 SMT input
39 0 0x60178804 FBM Timer
24 0 0x60425070 Compute load avgs
11 0 0x605210A8 ARP Input
69 0 0x605FDAF4 DHCPD Database
69 0 0x605FD568 DHCPD Database
51 0 0x60670B3C IP Cache Ager
69 0 0x605FD568 DHCPD Database
36 0 0x606E96DC SSS Test Client
69 0 0x605FD568 DHCPD Database
--More--
Table 130 describes the significant fields shown in the display.
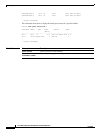
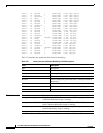
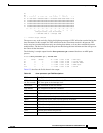
The following is sample output from the show processes process-id command:
Router# show processes 6
Process ID 6 [Pool Manager], TTY 0
Memory usage [in bytes]
Holding: 921148, Maximum: 940024, Allocated: 84431264, Freed: 99432136
Getbufs: 0, Retbufs: 0, Stack: 12345/67890
CPU usage
PC: 0x60887600, Invoked: 188, Giveups: 100, uSec: 24
5Sec: 3.03%, 1Min: 2.98%, 5Min: 1.55%, Average: 0.58%,
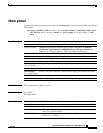
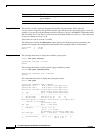
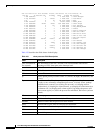
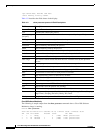
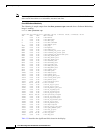
Table 130 show processes history Field Descriptions
Field Description
PID Process ID.
Exectime (ms) Execution time of the most recent run or the total execution time of the most recent
consecutive runs.
Caller PC Current program counter of this process before it was suspended.
Process Name Name of the process.