Using Trend Link for Fluke
Getting the Right Look for Your Trend Link Chart
5
5-23
• Constant Interval: Select this option to enter the exact time interval that
a vertical grid line should represent.
• Pixel Width: Select this option to enter the distance between vertical grid
lines in pixels.
• Use scale tickmarks: If you select this option, horizontal grid lines draw
to match the tickmark labels on the band bars.
• Use Pixels: If you select this option, you can enter the distance between
horizontal grid lines in pixels.
3. After making your selections in the Background Preferences dialog box, click
OK.
Real Time Frequency Update 5-23.
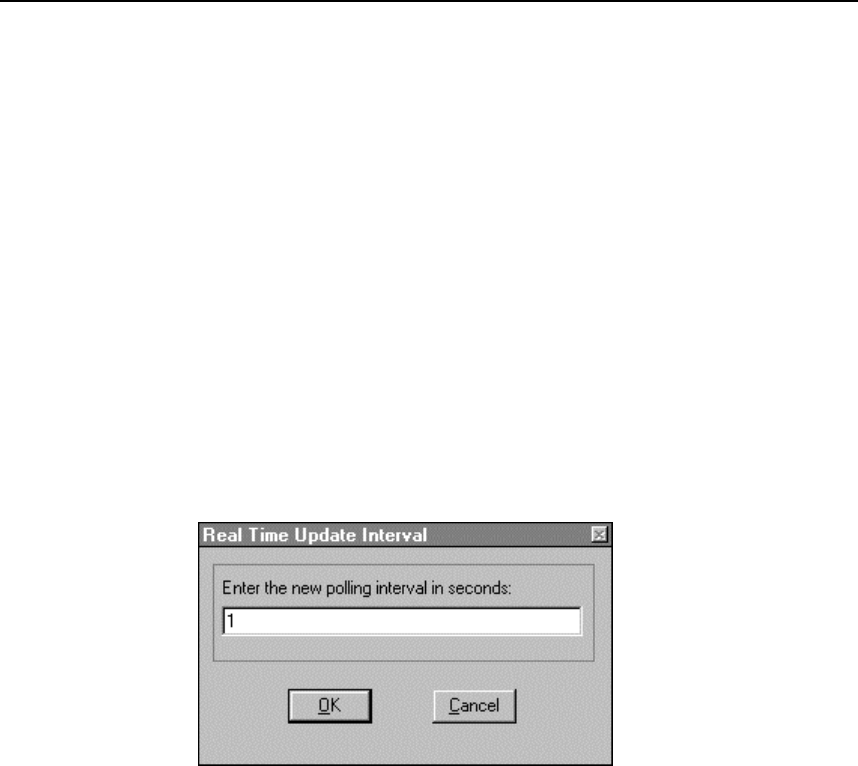
Complete the following procedure to modify the frequency update period for the
real time display. The default (and minimum time) is 1 second. The maximum
entry is 1410065 seconds.
1. Select Preferences | Real Time Freq to open the Real Time Interval dialog
box.
ds138s.bmp
2. Enter the desired number of seconds for the real time interval. The range is 1
to 1410065. You cannot enter fractions of seconds. Click OK.
Adding or Changing the Chart Title 5-24.
Complete the following procedure to add or change the title of the chart at the
very top of the chart window. By convention, the title is the name of the Trend
Link file with the *.cht extension, for example, data.cht. However, you can
use this procedure to enter any custom title.
