


Chapter 4. Monitoring remote server status
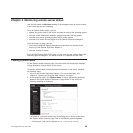
Use the links under the Monitors heading of the navigation pane to view the status
of the server that you are accessing.
From the System Status pages, you can:
v Monitor the power status of the server and view the state of the operating system
v View the server temperature readings, voltage thresholds, and fan speeds
v View the latest server operating-system-failure screen capture
v View the list of users who are logged in to the Remote Supervisor Adapter II
From
the Event Log page, you can:
v View certain Advanced System Management events that are recorded in the
event log of the Remote Supervisor Adapter II
v View the severity of events
From
the Vital Product Data (VPD) page, you can view the vital product data of the
Remote Supervisor Adapter II, the server in which it is installed, and the ISMP.
Viewing system health
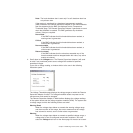
On the System Health Summary page, you can monitor the temperature readings,
voltage thresholds, and fan status of your server.
To view the system health and environmental information of the server, complete
the following steps:
1. Log in to the Remote Supervisor Adapter II. For more information, see
Chapter 2, “Opening and using the Web interface,” on page 5.
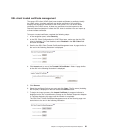
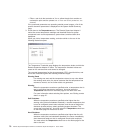
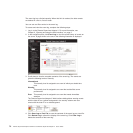
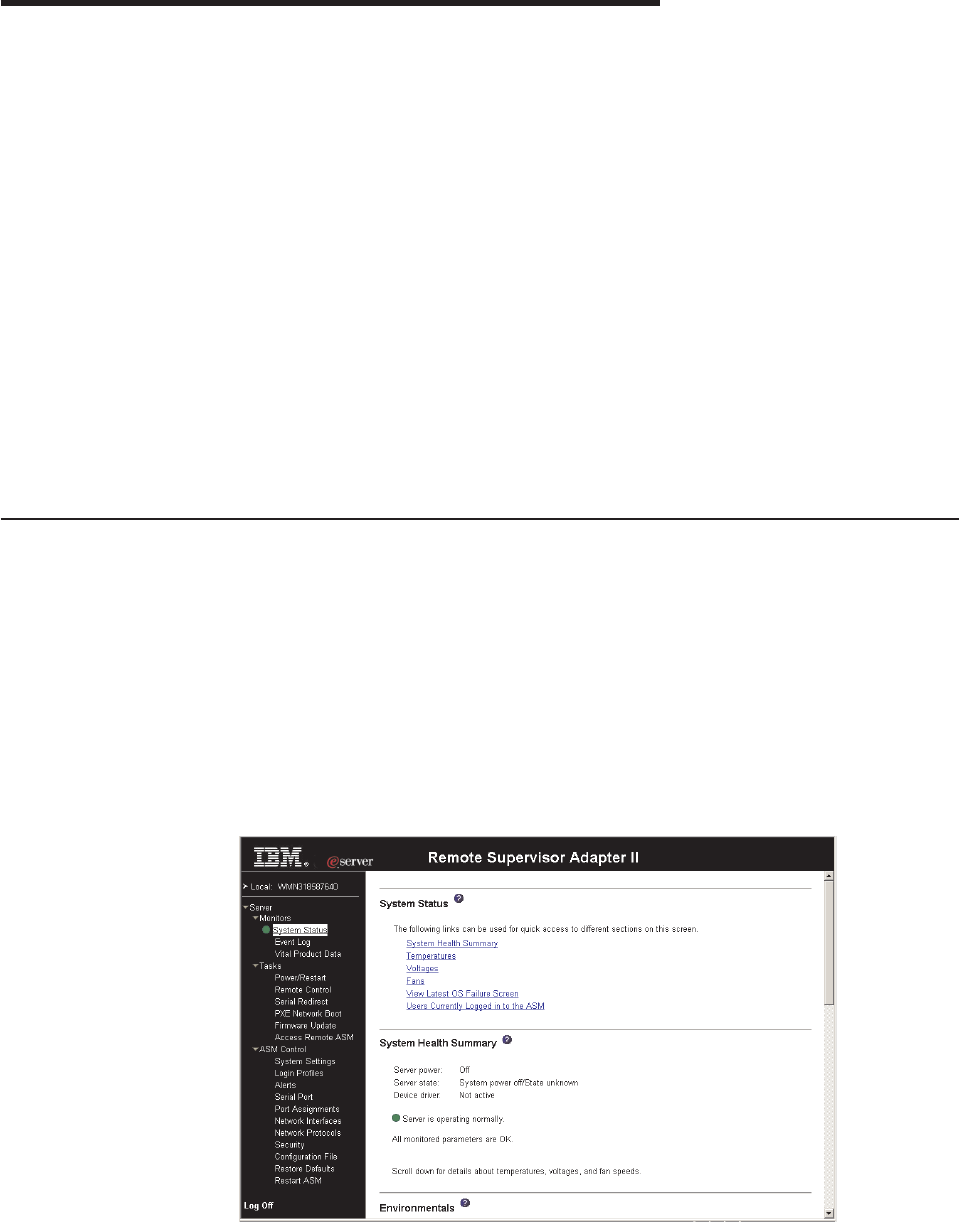
2. In the navigation pane, click System Status to view a dynamically-generated
update of the overall health of the server. A page similar to the one in the
following illustration is displayed.
The status of your server determines the message that is shown at the top of
the System Health Summary page. One of the following symbols appears:
v A solid green circle and the phrase Server is operating normally
© Copyright IBM Corp. 2003, 2007 69