Reference
3-28
WFM700 Series Waveform Monitors User Manual
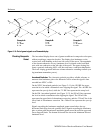
Example A:
R--Ok
G > 700 mV
B--Ok
Example B:
R--Ok
G--Ok
B > 700 mV
Example C:
R--Ok
G -- Ok, 350 mV
B<0mV
Figure 3- 10: Out-of-gamut signals on a Diamond display
The Arrowhead display shows out of gamut conditions in composite color-space,
without requiring a composite decoder. The display plots luminance on the
vertical axis, with blanking at the lower left corner of the arrow. The magnitude
of the chroma subcarrier at every luminance level is plotted on the horizontal
axis, with zero subcarrier at the left edge of the arrow. The upper sloping line
forms a graticule indicating 100% color bar total luma + subcarrier amplitudes.
The lower sloping graticule indicates a luma--subcarrier extending towards sync
tip (maximum transmitter power).
Arrowhead Graticules. The electronic graticule provides a reliable reference to
measure what luminance plus color subcarrier will be when the signal is later
encoded into NTSC or PAL.
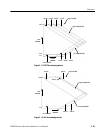
On the NTSC Arrowhead graticule (see Figure 3--11), the 120 IRE line repre-
sents the level at which a transmitter starts clipping the signal. The --40 IRE line
represents the sync tip level, while the 7.5 IRE line represents the setup level.
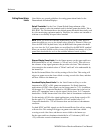
On the PAL Arrowhead graticule (see Figure 3--12), the 950 mV line represents
the level at which a transmitter starts clipping the signal. The 930 mV line
represents the upper limit of chrominance excursion, and the --230 mV line is the
lower limit of chrominance excursion. The --300 mV line represents the sync tip
level.
Signals exceeding the luminance amplitude gamut extend above the top
horizontal limit (top electronic graticule line). Signals exceeding the luminance
plus or minus peak chrominance amplitude gamut extend beyond the upper and
lower diagonal limits. The bottom horizontal line shows the minimum allowed
luminance level.
Checking Composite
Gamut


