106 Chapter 6: Basic Function Graphing
06BASFUN.DOC TI-89/TI-92 Plus: Basic Function Graphing (English) Susan Gullord Revised: 02/23/01 4:09 PM Printed: 02/23/01 4:18 PM Page 106 of 22
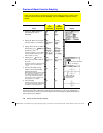
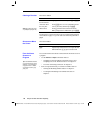
Steps
³
TI
-
89
Keystrokes
›
TI
-
92 Plus
Keystrokes Display
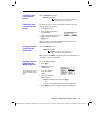
1. Display the
MODE
dialog box.
For
Graph
mode, select
FUNCTION
.
3
B
1
¸
3
B
1
¸
2. Display the Home screen. Then
store the radius, 5, in variable
r
.
"
5
§j
R
¸
¥"
5
§
R
¸
5
!
r
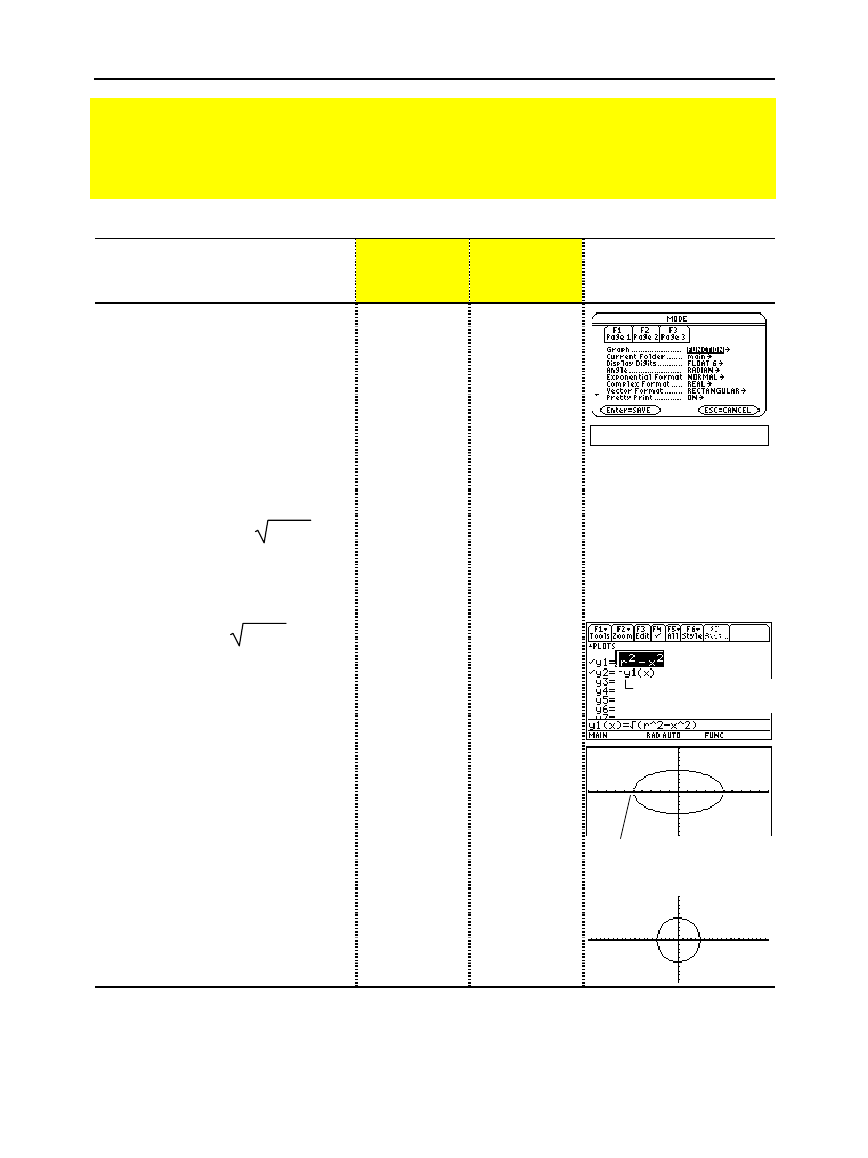
3. Display and clear the Y= Editor.
Then define
y1(x)
=
rñ
-
xñ
, the
top half of a circle.
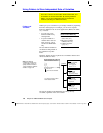
In function graphing, you must define
separate functions for the top and
bottom halves of a circle.
¥#
ƒ
8
¸
¸2]
j
R
Z
2
|
X
Z
2
d¸
¥#
ƒ
8
¸
¸2]
R
Z
2
|
X
Z
2
d¸
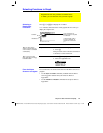
4. Define
y2(x)
=
ë
rñ
-
xñ
, the
function for the bottom half of
the circle.
The bottom half is the negative of the
top half, so you can define y2(x) =
ë y1(x).
¸
·
Y1
c
X
d
¸
¸
·
Y1
c
X
d
¸
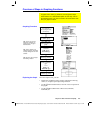
5. Select the
ZoomStd
viewing
window, which automatically
graphs the functions.
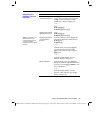
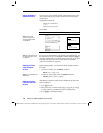
In the standard viewing window, both
the x and y axes range from ë 10 to
10. However, this range is spread
over a longer distance along the x
axis than the y axis. Therefore, the
circle appears as an ellipse.
„
6
„
6
6. Select
ZoomSqr
.
ZoomSqr increases the range along
the x axis so that circles and squares
are shown in correct proportion.
„
5
„
5
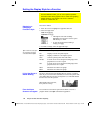
Note:
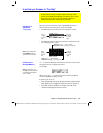
There is a gap between the top and bottom halves of the circle because each half is a
separate function. The mathematical endpoints of each half are (
-
5,0) and (5,0). Depending on
the viewing window, however, the
plotted
endpoints for each half may be slightly different from
their
mathematical
endpoints.
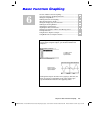
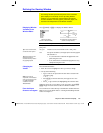
Preview of Basic Function Graphing
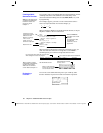
Graph a circle of radius 5, centered on the origin of the coordinate system. View the circle
using the standard viewing window (
ZoomStd
). Then use
ZoomSqr
to adjust the viewing
window.
Notice slight gap
between top and
bottom halves.
Use the full function name
y1(x), not simply y1.


