v
00_FRONT.DOC TI-89/TI-92 Plus: Front Matter (English) Bob Fedorisko Revised: 02/23/01 10:37 AM Printed: 02/23/01 2:10 PM Page v of 16
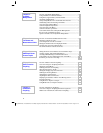
Preview of Polar Graphing.................................................................... 134
Overview of Steps in Graphing Polar Equations................................ 135
Differences in Polar and Function Graphing...................................... 136
Preview of Sequence Graphing ............................................................ 140
Overview of Steps in Graphing Sequences......................................... 141
Differences in Sequence and Function Graphing.............................. 142
Setting Axes for Time, Web, or Custom Plots.................................... 146
Using Web Plots...................................................................................... 147
Using Custom Plots................................................................................ 150
Using a Sequence to Generate a Table................................................ 151
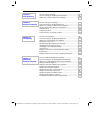
Preview of 3D Graphing........................................................................ 154
Overview of Steps in Graphing 3D Equations.................................... 156
Differences in 3D and Function Graphing.......................................... 157
Moving the Cursor in 3D ....................................................................... 160
Rotating and/or Elevating the Viewing Angle..................................... 162
Animating a 3D Graph Interactively.................................................... 164
Changing the Axes and Style Formats................................................. 165
Contour Plots.......................................................................................... 167
Example: Contours of a Complex Modulus Surface ......................... 170
Implicit Plots........................................................................................... 171
Example: Implicit Plot of a More Complicated Equation................. 173
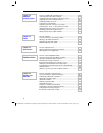
Preview of Differential Equation Graphing........................................ 176
Overview of Steps in Graphing Differential Equations..................... 178
Differences in Diff Equations and Function Graphing...................... 179
Setting the Initial Conditions................................................................ 184
Defining a System for Higher-Order Equations ................................. 186
Example of a 2nd-Order Equation ....................................................... 187
Example of a 3rd-Order Equation........................................................ 189
Setting Axes for Time or Custom Plots............................................... 190
Example of Time and Custom Axes .................................................... 191
Example Comparison of RK and Euler ............................................... 193
Example of the deSolve( ) Function.................................................... 196
Troubleshooting with the Fields Graph Format ................................ 197
Chapter 8:
Polar Graphing
Chapter 9:
Sequence Graphing
Chapter 10:
3D Graphing
Chapter 11:
Differential
Equation Graphing


