114 Chapter 6: Basic Function Graphing
06BASFUN.DOC TI-89/TI-92 Plus: Basic Function Graphing (English) Susan Gullord Revised: 02/23/01 4:09 PM Printed: 02/23/01 4:18 PM Page 114 of 22
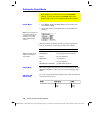
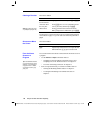
From the Y= Editor, Window Editor, or Graph screen, press
ƒ
and
select
9:Format
.
¦ The
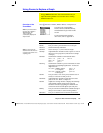
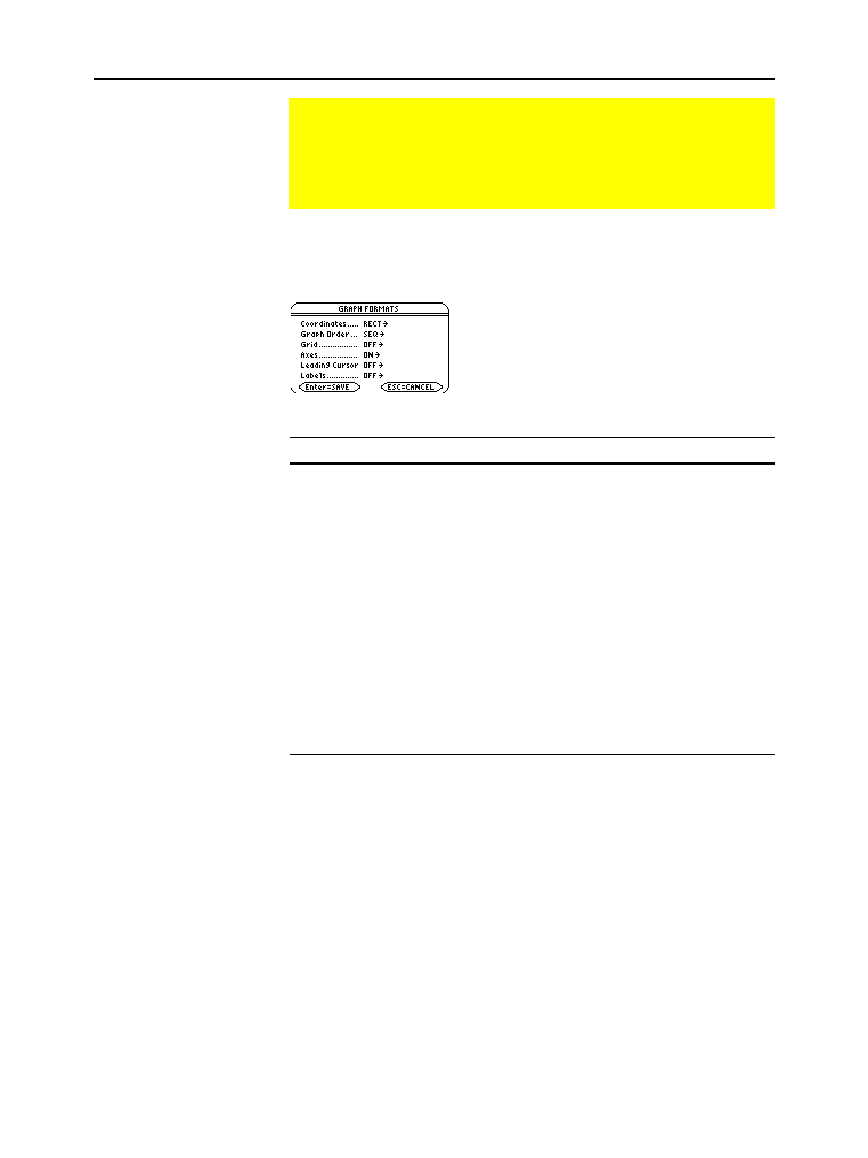
GRAPH FORMATS
dialog
box shows the current
settings.
¦ To exit without making a
change, press
N
.
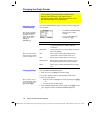
Format Description
Coordinates
Shows cursor coordinates in rectangular (
RECT
)
or polar (
POLAR
) form, or hides (
OFF
) the
coordinates.
Graph Order
Graphs functions one at a time (
SEQ
) or all at the
same time (
SIMUL
).
Grid
Shows (
ON
) or hides (
OFF
) grid points that
correspond to the tick marks on the axes.
Axes
Shows (
ON
) or hides (
OFF
) the x and y axes.
Leading Cursor
Shows (
ON
) or hides (
OFF
) a reference cursor
that tracks the functions as they are graphed.
Labels
Shows (
ON
) or hides (
OFF
) labels for the x and y
axes.
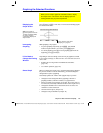
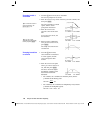
From the
GRAPH FORMATS
dialog box:
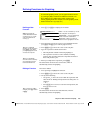
1. Move the cursor to highlight the format setting.
2. Press
B
to display a menu of valid settings for that format.
3. Select a setting. Either:
¦ Move the cursor to highlight the setting, and then press
¸
.
— or —
¦ Press the number for that setting.
4. After changing all applicable format settings, press
¸
to save
your changes and close the
GRAPH FORMATS
dialog box.
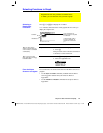
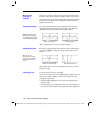
Changing the Graph Format
You can set the graph format to show or hide reference
elements such as the axes, a grid, and the cursor’s
coordinates. Function graphs, parametric graphs, etc., have
their own independent set of graph formats.
Displaying Graph
Format Settings
Tip: You also can display
the GRAPH FORMATS
dialog box from the Y=
Editor, Window Editor, or
Graph screen. Press:
TI
.
89:
¥
Í
TI
.
92 Plus:
¥
F
Tip: To turn off tick marks,
define the viewing window
so that xscl and/or yscl = 0.
Changing Settings
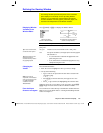
Tip: To cancel a menu or
exit the dialog box without
saving any changes, use
N
instead of
¸
.


