Chapter 6: Basic Function Graphing 109
06BASFUN.DOC TI-89/TI-92 Plus: Basic Function Graphing (English) Susan Gullord Revised: 02/23/01 4:09 PM Printed: 02/23/01 4:18 PM Page 109 of 22
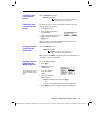
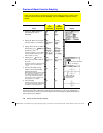
1. Press
¥#
or
O
2
to display the Y= Editor.
2. Press
D
and
C
to move the cursor to any undefined function.
(Use
2D
and
2C
to scroll one page at a time.)
3. Press
¸
or
…
to move the cursor to the entry line.
4. Type the expression to define the function.
¦ The independent variable in function graphing is
x
.
¦
The expression can refer to other variables, including
matrices, lists, and other functions. Only floats and lists of
floats will produce a plot.
5. When you complete the expression, press
¸
.
The function list now shows the new function, which is
automatically selected for graphing.
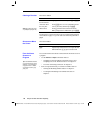
From the Y= Editor:
1. Press
D
and
C
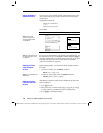
to highlight the function.
2. Press
¸
or
…
to move the cursor to the entry line.
3. Do any of the following.
¦ Use
B
and
A
to move the cursor within the expression and
edit it. Refer to “Editing an Expression in the Entry Line” in
Chapter 2.
— or —
¦ Press
M
once or twice to clear the old expression, and
then type the new one.
4. Press
¸
.
The function list now shows the edited function, which is
automatically selected for graphing.
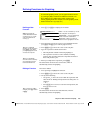
Defining Functions for Graphing
In FUNCTION graphing mode, you can graph functions named
y1(x) through y99(x). To define and edit these functions, use
the Y= Editor. (The Y= Editor lists function names for the
current graphing mode. For example, in POLAR graphing mode,
function names are r1(
q
), r2(
q
), etc.)
Defining a New
Function
Note: The function list
shows abbreviated function
names such as y1, but the
entry line shows the full
name y1(x).
Tip: If you accidentally
move the cursor to the entry
line, press
N
to move it
back to the function list.
Tip: For an undefined
function, you do not need to
press
¸
or
…
. When
y
ou begin typing, the cursor
moves to the entry line.
Editing a Function
Tip: To cancel any editing
changes, press
N
instead
of
¸
.
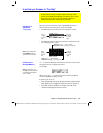
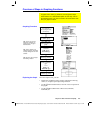
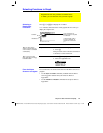
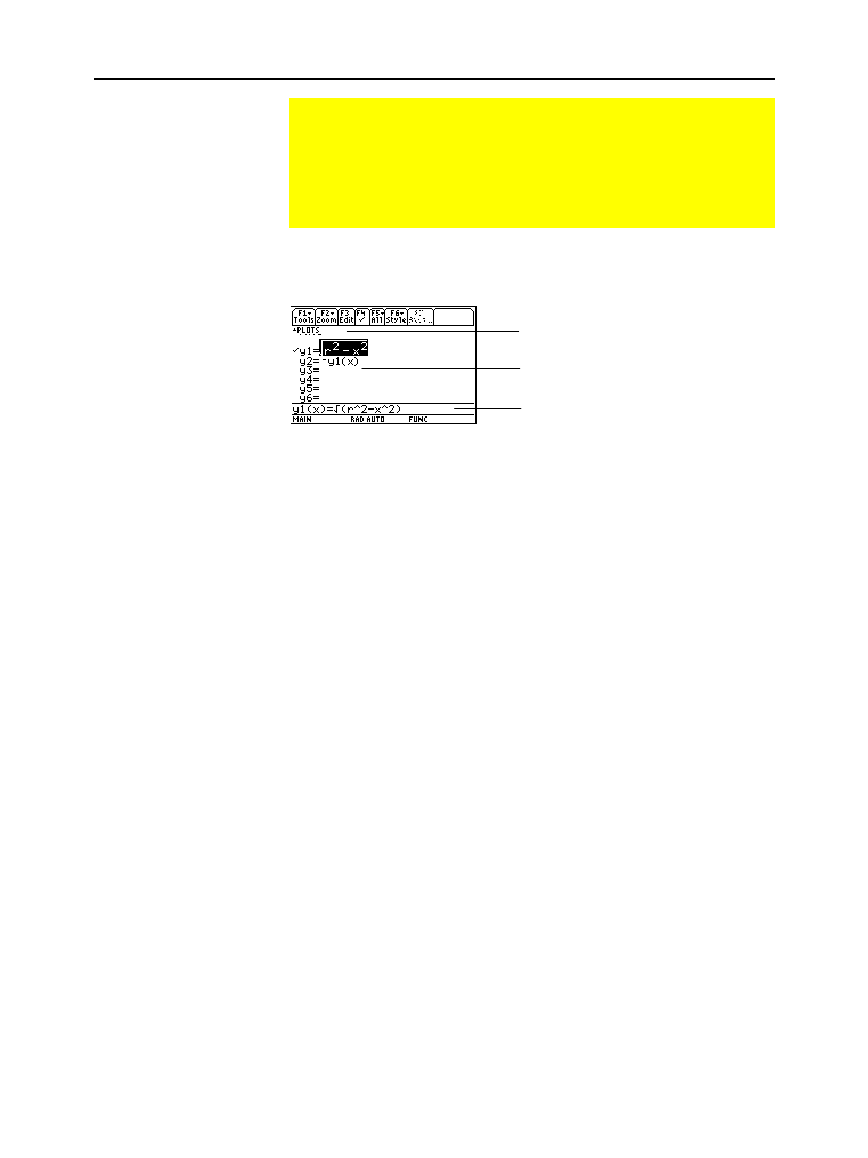
Function List
— You can scroll through
the list of functions and definitions.
Entry Line
— Where you define or
edit the function highlighted in the list.
Plots
— You can scroll above y1= to see
a list of stat plots. See Chapter 16.


