226 Chapter 13: Tables
13TABLES.DOC TI-89/TI-92 Plus: Tables (English) Susan Gullord Revised: 02/23/01 1:08 PM Printed: 02/23/01 2:16 PM Page 226 of 10
Define and select the applicable functions on the Y= Editor (
¥#
).
This example uses
y1(x) = x
òì
x/3
.
Then enter the initial table
parameters (
¥&
).
To display the Table screen, press
¥'
or
O
5
.
The cursor initially highlights the cell that contains the starting value
of the independent variable. You can move the cursor to any cell that
contains a value.
To move the cursor: Press:
One cell at a time
,
C
,
B
, or
A
One page at a time
2
and then
D
,
C
,
B
, or
A
The header row and the first column are fixed so that they cannot
scroll off the screen.
¦ When you scroll down or up, the variable and function names are
always visible across the top of the screen.
¦ When you scroll right or left, the values of the independent
variable are always visible along the left side of the screen.
Displaying an Automatic Table
If
Independent
=
AUTO
on the TABLE SETUP dialog box, a table
is generated automatically when you display the Table screen.
If
Graph <
-
> Table
=
ON
, the table matches the trace values
from the Graph screen. If
Graph <
-
> Table
=
OFF
, the table is
based on the values you entered for
tblStart
and
@
tbl
.
Before You Begin
Displaying the
Table Screen
Tip: You can scroll back
from the starting value by
pressing
C
or
2C
.
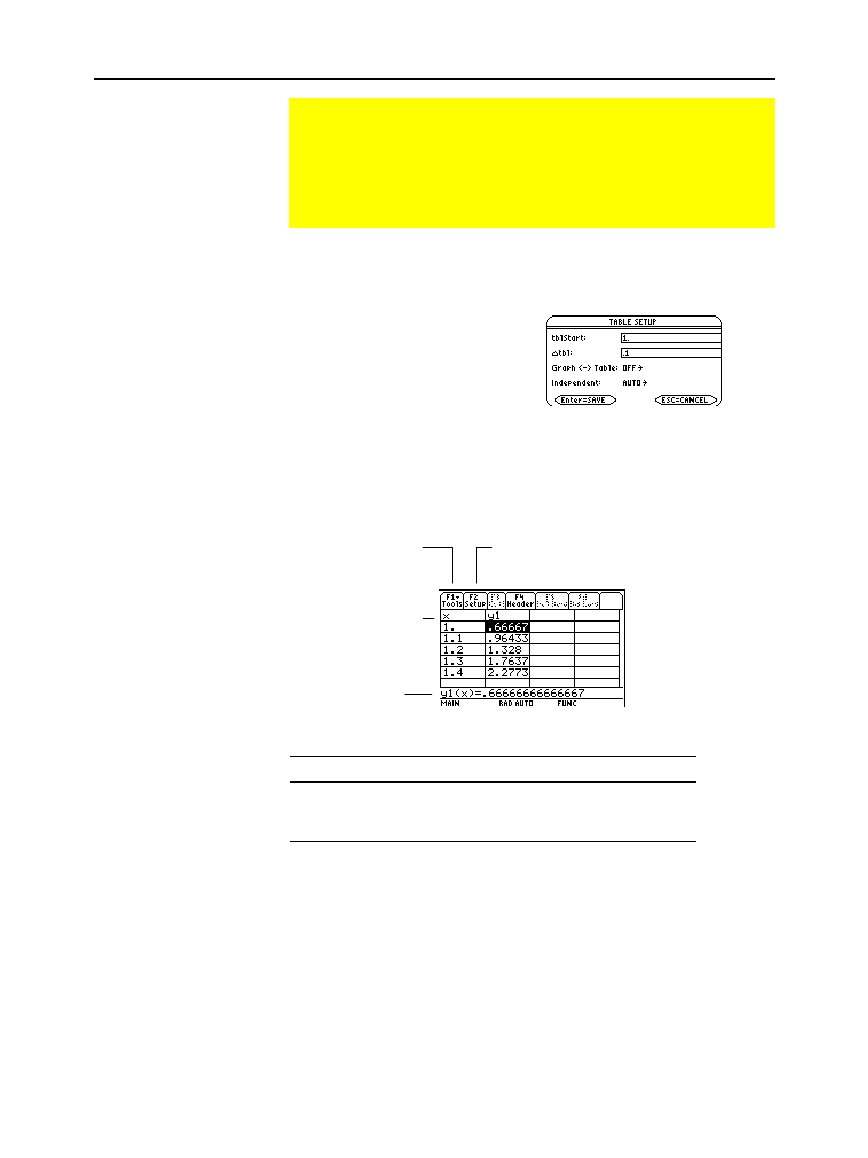
Entry line shows
full value of
highlighted cell.
Header row shows
names of independent
variable (x) and
selected functions
(y1).
First column shows
values of the
independent
variable.
Other columns show corresponding
values of the functions selected in
the Y= Editor.
